2023 Miami-Dade County, Florida Demographics | Comprehensive Overview
Data and insights for Miami-Dade County, Florida, including population, age & gender distribution, race & ethnicity, median & household income distribution, property value distribution, educational attainment, health insurance coverage, nativity & citizenship, commuting & transportation, employment, veteran service, poverty & income and SNAP/food stamp recipients. Based on 2023 American Community Survey Estimates.
Miami-Dade County, Florida Key Demographic Statistics (2023 Estimates)
Key demographic statistics summarized from the U.S. Census Bureau's 2023 American Community Survey (ACS).
Source: U.S. Census Bureau, 2023 American Community Survey (ACS) Estimates
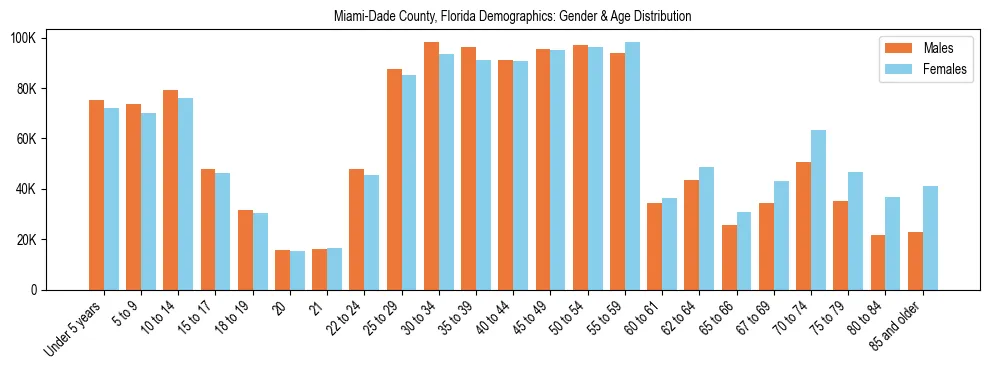
Miami-Dade County, Florida Demographics: Age & Gender Distribution (2023)
Key Demographic Indicators for Miami-Dade County, Florida
The following statistics highlight Miami-Dade County, Florida population and median age, based on U.S. Census Bureau 2023 ACS Estimates.
- Total Population
- 2,685,296
- Median Age (Total)
- 40.8 years
- Median Age (Male)
- 39.4 years
- Median Age (Female)
- 42.3 years
Miami-Dade County, Florida Age Distribution Comparison with Florida 2023
Compare Miami-Dade County, Florida age demographics with Florida to understand regional demographic patterns.
| Metric | Miami-Dade County, Florida | Florida | Difference |
|---|---|---|---|
| Median Age | 40.8 yrs | 42.7 yrs | -1.9 yrs |
| Under 5 years | 5.50% | 4.91% | +0.6pp |
| Children (5–17 years) | 14.64% | 14.31% | +0.3pp |
| Young Adults (18–24) | 8.17% | 8.16% | +0.0pp |
| Middle-aged (35–54) | 28.05% | 25.24% | +2.8pp |
| Seniors (65+) | 16.84% | 21.80% | -5.0pp |
| Total Dependency Ratio | 58.66 | 69.54 | -10.9 |
Note: "pp" indicates percentage points. "yrs" indicates years. The dependency ratio measures the burden on working-age population (18-64) to support dependents (under 18 and 65+).
Dependency Ratios Analysis
- Total Dependency Ratio
- 58.66
- Youth Dependency Ratio
- 31.95 Population under 18 relative to working age (18-64).
- Old-Age Dependency Ratio
- 26.71 Population 65+ relative to working age (18-64).
A higher ratio indicates a greater financial and social burden on the working population to support non-working age groups.
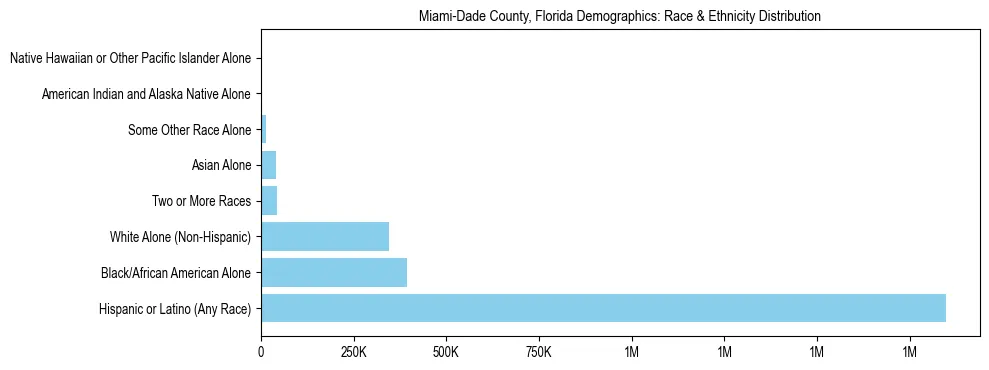
Miami-Dade County, Florida Demographics: Racial and Ethnic Composition (2023)
Diversity & Cultural Composition of Miami-Dade County, Florida
The racial makeup and ethnic composition of Miami-Dade County, Florida are detailed below, drawing from the U.S. Census Bureau's 2023 ACS Estimates.
- Diversity Index Score
- 48.86
- Diversity Tier
- moderate
- Definition
- The probability that two individuals chosen at random will be from different racial or ethnic groups.
Diversity Comparison with Florida
Compare Miami-Dade County, Florida racial and ethnic demographics with Florida to understand regional diversity patterns.
Miami-Dade County, Florida Diversity
48.86
moderateFlorida Diversity
65.38
highRacial and Ethnic Composition Comparison
| Racial/Ethnic Group | Miami-Dade County, Florida | Florida | Difference |
|---|---|---|---|
| Hispanic or Latino (Any Race) | 68.77% | 28.69% | +40.1pp |
| Black/African American Alone | 14.62% | 14.29% | +0.3pp |
| White Alone (Non-Hispanic) | 12.88% | 49.07% | -36.2pp |
| Two or More Races | 1.65% | 4.05% | -2.4pp |
| Asian Alone | 1.47% | 3.02% | -1.6pp |
| Some Other Race Alone | 0.52% | 0.69% | -0.2pp |
| American Indian and Alaska Native Alone | 0.08% | 0.11% | -0.0pp |
| Native Hawaiian or Other Pacific Islander Alone | 0.02% | 0.08% | -0.1pp |
| Diversity Index Score | 48.86 | 65.38 | -16.52 |
Note: "pp" indicates percentage points. Higher Diversity Index Scores (green) indicate greater racial/ethnic diversity.
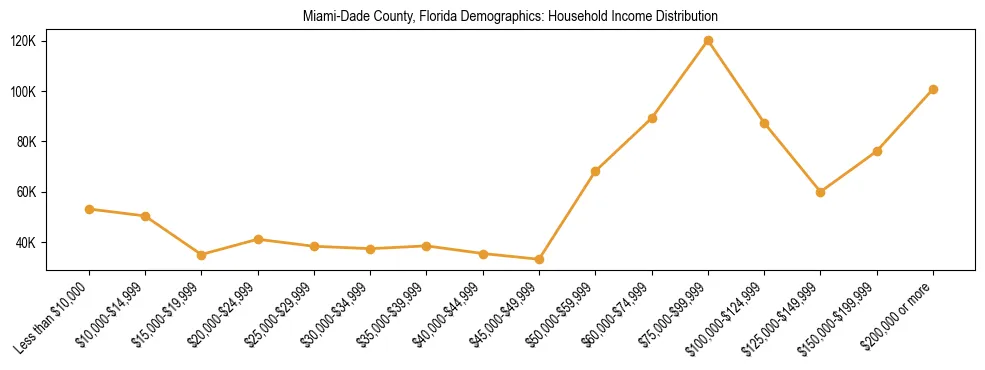
Miami-Dade County, Florida Economic Demographics: Household Income Statistics (2023)
Economic Snapshot for Miami-Dade County, Florida
The following data illustrates the financial landscape of Miami-Dade County, Florida, based on the latest U.S. Census Bureau 2023 ACS Estimates.
- Median Household Income
- $68,694 (Adjusted for inflation)
- Total Households Analyzed
- 964,805
Income Comparison with Florida
Compare Miami-Dade County, Florida household income with Florida to understand regional economic patterns.
Miami-Dade County, Florida
$68,694
Florida
$77,735
Income Distribution Comparison
| Income Bracket | Miami-Dade County, Florida | Florida | Difference |
|---|---|---|---|
| Less than $20,000 | 14.38% | 11.07% | +3.3pp |
| $20,000 to $34,999 | 12.12% | 10.00% | +2.1pp |
| $35,000 to $49,999 | 11.12% | 10.58% | +0.5pp |
| $50,000 to $74,999 | 16.31% | 16.67% | -0.4pp |
| $75,000 to $149,999 | 27.73% | 30.91% | -3.2pp |
| $150,000 or more | 18.34% | 20.77% | -2.4pp |
Note: "pp" indicates percentage points. Higher percentages in high-income brackets (green) indicate greater affluence compared to Florida.
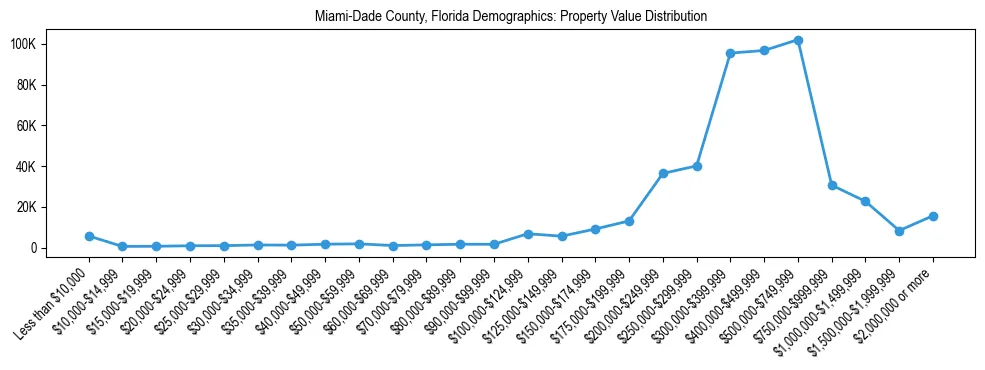
Miami-Dade County, Florida Real Estate Demographics: Property Values (2023)
Real Estate Market Snapshot for Miami-Dade County, Florida
The following data highlights the distribution of owner-occupied housing values in Miami-Dade County, Florida, based on the latest U.S. Census Bureau 2023 ACS Estimates.
- Median Property Value
- $425,400
- Total Properties Analyzed
- 503,562 (Owner-occupied units)
Property Value Comparison with Florida
Compare Miami-Dade County, Florida property values with Florida to understand regional real estate market patterns.
Miami-Dade County, Florida
$425,400
Florida
$396,900
Property Value Distribution Comparison
| Value Bracket | Miami-Dade County, Florida | Florida | Difference |
|---|---|---|---|
| Less than $25,000 | 1.56% | 2.24% | -0.7pp |
| $25,000 to $49,999 | 1.02% | 2.09% | -1.1pp |
| $50,000 to $99,999 | 1.49% | 3.41% | -1.9pp |
| $100,000 to $199,999 | 6.88% | 8.27% | -1.4pp |
| $200,000 to $499,999 | 53.40% | 50.21% | +3.2pp |
| $500,000 to $999,999 | 30.88% | 30.01% | +0.9pp |
| $1,000,000 or more | 4.77% | 3.77% | +1.0pp |
Note: "pp" indicates percentage points. Higher percentages in high-value brackets (green) indicate more expensive real estate compared to Florida.
Miami-Dade County, Florida Educational Attainment Statistics (2023)
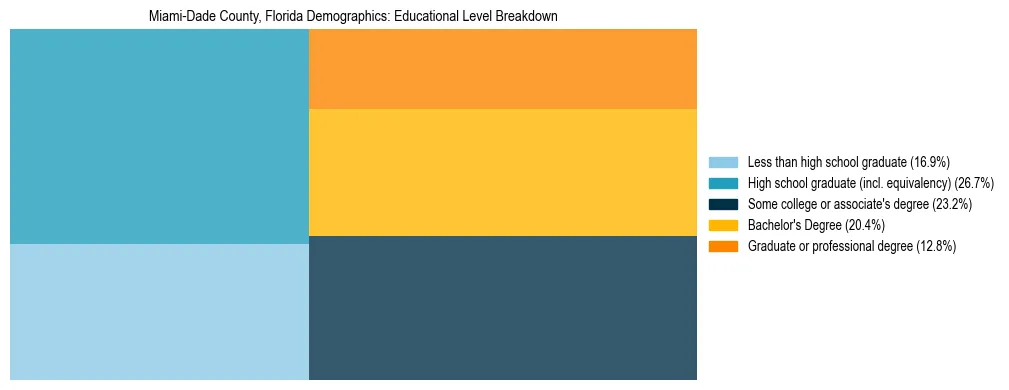
Education Snapshot for Miami-Dade County, Florida
The following statistics represent the educational background of residents aged 25 and older in Miami-Dade County, Florida, based on U.S. Census Bureau 2023 ACS Estimates.
- High School Graduate or Higher
- 83.06%
- Bachelor's Degree or Higher
- 33.21%
- Total Population Analyzed (25+)
- 1,925,233
Education Level Comparison with Florida
Compare Miami-Dade County, Florida educational attainment with Florida to understand regional education patterns.
Bachelor's+ in Miami-Dade County, Florida
33.21%
Bachelor's+ in Florida
35.84%
Detailed Education Level Comparison
| Education Level | Miami-Dade County, Florida | Florida | Difference |
|---|---|---|---|
| Less than HS | 16.94% | 9.64% | +7.3pp |
| HS Graduate | 26.65% | 26.45% | +0.2pp |
| Some College/Associate's | 23.20% | 28.08% | -4.9pp |
| Bachelor's Degree | 20.44% | 22.14% | -1.7pp |
| Graduate/Professional | 12.77% | 13.69% | -0.9pp |
| HS Graduate or Higher | 83.06% | 90.36% | -7.3pp |
Note: "pp" indicates percentage points. Higher percentages in advanced education levels (green badges) indicate higher educational attainment compared to Florida.
Miami-Dade County, Florida Health Insurance Coverage Statistics (2023)
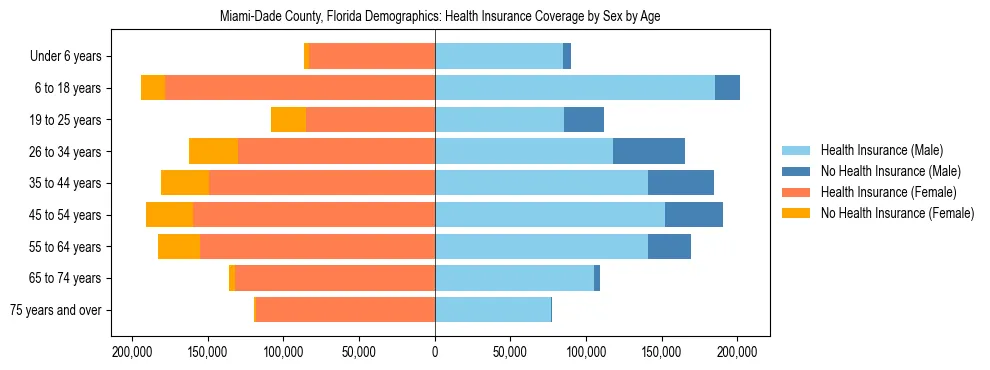
Healthcare Coverage Snapshot for Miami-Dade County, Florida
The following data illustrates the health coverage landscape of Miami-Dade County, Florida, based on U.S. Census Bureau 2023 ACS Estimates.
- Overall Uninsured Rate
- 14.3%
- Total Uninsured Population
- 381,592
- Total Civilian Population
- 2,661,149
The uninsured rates vary significantly by demographic group. Children under 18 and seniors aged 65+ generally have higher coverage rates due to public programs like Medicaid/CHIP and Medicare.
Health Insurance Coverage Comparison with Florida
Compare Miami-Dade County, Florida health insurance coverage with Florida to understand regional healthcare access patterns.
Uninsured in Miami-Dade County, Florida
14.3%
Uninsured in Florida
10.9%
Uninsured Rates by Age and Sex
| Age Group | Miami-Dade County, Florida | Florida | ||
|---|---|---|---|---|
| Male | Female | Male | Female | |
| Under 18 | 7.2% | 6.8% | 8.5% | 8.4% |
| 18-34 years | 26.8% | 20.5% | 22.6% | 16.6% |
| 35-64 years | 20.3% | 16.5% | 14.9% | 12.0% |
| 65+ years | 2.4% | 2.1% | 1.0% | 1.0% |
Note: Lower uninsured rates indicate better health insurance coverage. The 18-34 age group typically has the highest uninsured rates, while seniors 65+ have near-universal coverage through Medicare.
Miami-Dade County, Florida Nativity & Citizenship Statistics (2023)
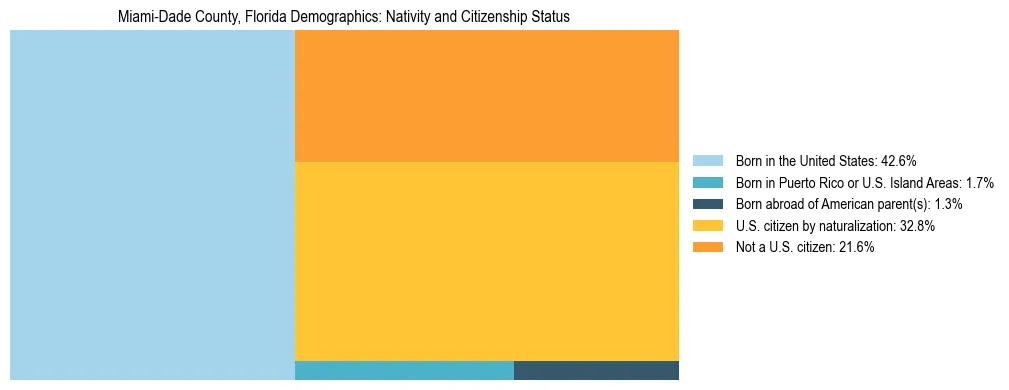
Citizenship Snapshot for Miami-Dade County, Florida
The following data details the citizenship status and nativity of the population in Miami-Dade County, Florida, based on U.S. Census Bureau 2023 ACS Estimates.
- U.S. Citizenship Rate
- 78.4% (Native-born + Naturalized)
- Naturalized Citizens
- 879,835 (Foreign-born individuals who acquired citizenship)
- Non-Citizen Residents
- 579,183
Citizenship Comparison with Florida
Compare Miami-Dade County, Florida citizenship and nativity with Florida to understand regional immigration and naturalization patterns.
Citizenship in Miami-Dade County, Florida
78.4%
Citizenship in Florida
89.6%
Nativity and Citizenship Comparison
| Nativity/Citizenship Status | Miami-Dade County, Florida | Florida | Difference |
|---|---|---|---|
| Born in the United States | 42.6% | 72.9% | -30.3pp |
| Born in PR or U.S. Territories | 1.7% | 2.5% | -0.8pp |
| Born abroad of American parent(s) | 1.3% | 1.5% | -0.2pp |
| U.S. citizen by naturalization | 32.8% | 12.7% | +20.1pp |
| Not a U.S. citizen | 21.6% | 10.4% | +11.2pp |
| Total U.S. Citizens | 78.4% | 89.6% | -11.2pp |
Note: "pp" indicates percentage points. Higher naturalization rates (green) indicate greater immigrant integration compared to Florida.
Miami-Dade County, Florida Commuting & Transportation Statistics (2023)
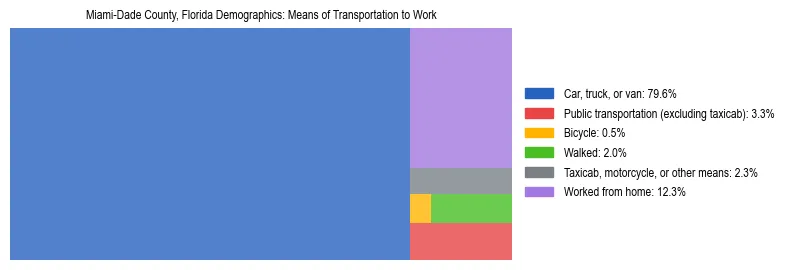
Commuter Snapshot for Miami-Dade County, Florida
The following data details the commuting habits of the workforce in Miami-Dade County, Florida, based on U.S. Census Bureau 2023 ACS Estimates.
- Drove to Work (Car/Truck/Van)
- 79.6%
- Public Transportation Usage
- 3.3%
- Work From Home Rate
- 12.3%
- Total Workers Analyzed
- 1,325,026
Transportation Comparison with Florida
Compare Miami-Dade County, Florida commuting patterns with Florida to understand regional transportation preferences.
Drove in Miami-Dade County, Florida
79.6%
Drove in Florida
79.0%
Commute Mode Comparison
| Transportation Method | Miami-Dade County, Florida | Florida | Difference |
|---|---|---|---|
| Car, truck, or van | 79.6% | 79.0% | +0.6pp |
| Public transportation | 3.3% | 1.3% | +2.0pp |
| Bicycle | 0.5% | 0.5% | 0.0pp |
| Walked | 2.0% | 1.4% | +0.6pp |
| Taxicab, motorcycle, or other | 2.3% | 2.2% | +0.1pp |
| Worked from home | 12.3% | 15.5% | -3.2pp |
Note: "pp" indicates percentage points. Higher public transit or work-from-home rates (green) indicate more diverse commuting options compared to Florida.
Miami-Dade County, Florida Employment by Class of Worker (2023)
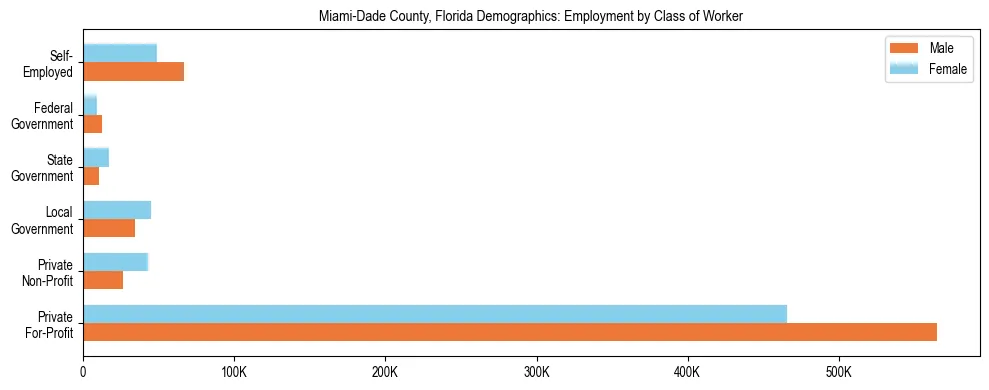
Workforce Snapshot for Miami-Dade County, Florida
The following statistics categorize the civilian employed population aged 16 and over in Miami-Dade County, Florida by their employment sector, based on U.S. Census Bureau 2023 ACS Estimates.
- Total Employed Civilian Population
- 1,349,198
- Private Sector (Profit & Non-Profit)
- Includes For-Profit and Non-Profit organizations
- Government Workers
- Includes Local, State, and Federal employees
- Self-Employed Workers
- Includes own not incorporated business workers
Employment Sector Comparison with Florida
Compare Miami-Dade County, Florida employment patterns with Florida to understand regional workforce composition differences.
Government Employment in Miami-Dade County, Florida
4.3% (M) / 5.3% (F)
Government Employment in Florida
5.3% (M) / 6.5% (F)
Employment Sector Comparison
| Employment Sector | Miami-Dade County, Florida | Florida | Difference |
|---|---|---|---|
| Private For-Profit (Combined) | M: 41.9% F: 34.5% | M: 40.5% F: 33.9% | M: +1.4pp F: +0.6pp |
| Private Non-Profit | M: 2.0% F: 3.2% | M: 2.5% F: 4.6% | M: -0.5pp F: -1.4pp |
| Government (All Levels) | M: 4.3% F: 5.3% | M: 5.3% F: 6.5% | M: -1.0pp F: -1.2pp |
| Self-Employed | M: 5.0% F: 3.7% | M: 3.7% F: 2.7% | M: +1.3pp F: +1.0pp |
Note: "pp" indicates percentage points. M = Male, F = Female. Green badges indicate higher government employment compared to Florida.
Definitions: "Private sector" includes employees of for-profit and non-profit companies. "Government" includes all local, state, and federal employees. "Self-employed" refers to those operating their own unincorporated businesses.
Miami-Dade County, Florida Veteran Population & Service Statistics (2023)
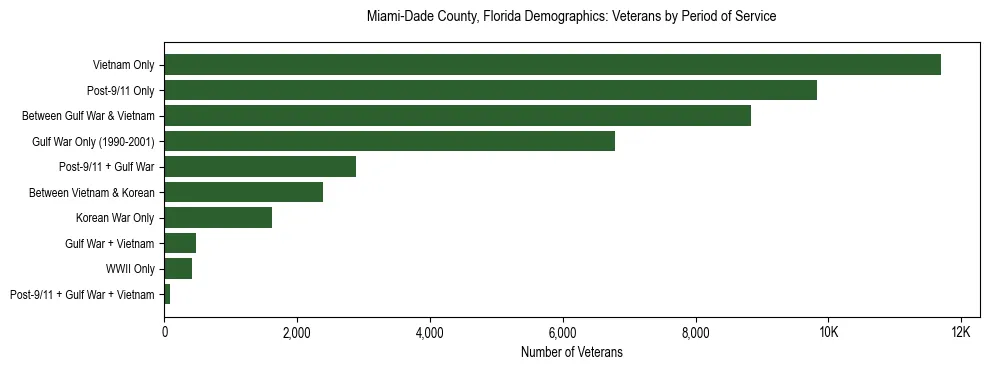
Veteran Community Snapshot for Miami-Dade County, Florida
The following data details the civilian veteran population aged 18 and over in Miami-Dade County, Florida, based on U.S. Census Bureau 2023 ACS Estimates.
- Total Civilian Veterans
- 45,319
- Primary Service Era
- Vietnam Era Only
11,696 veterans (25.8%)
Veteran Population Comparison with Florida
Compare Miami-Dade County, Florida veteran demographics with Florida to understand regional veteran service patterns.
Total Veterans in Miami-Dade County, Florida
45,319
Total Veterans in Florida
1,347,330
- Miami-Dade County, Florida: Vietnam Era Only (25.8%)
- Florida: Vietnam Era Only (31.4%)
Service Period Distribution Comparison
| Service Period | Miami-Dade County, Florida | Florida | Difference |
|---|---|---|---|
| Vietnam Era Only | 25.8% (11,696) | 31.4% (423,694) | -5.6pp |
| Post-9/11 Only | 21.7% (9,834) | 13.8% (185,410) | +7.9pp |
| Between Gulf War & Vietnam | 19.5% (8,827) | 14.8% (199,351) | +4.7pp |
| Gulf War Only | 15.0% (6,792) | 13.7% (185,078) | +1.3pp |
| Post-9/11 + Gulf War | 6.4% (2,891) | 8.5% (114,567) | -2.1pp |
| Between Vietnam & Korean | 5.3% (2,396) | 7.5% (101,158) | -2.2pp |
| Korean War Only | 3.6% (1,629) | 5.1% (68,151) | -1.5pp |
| Gulf War + Vietnam | 1.1% (481) | 2.2% (29,427) | -1.1pp |
| WWII Only | 0.9% (420) | 1.3% (18,004) | -0.4pp |
| Post-9/11 + Gulf War + Vietnam | 0.2% (94) | 0.4% (5,835) | -0.2pp |
| Vietnam + Korean | 0.2% (93) | 0.7% (9,197) | -0.5pp |
| Between Korean & WWII | 0.2% (78) | 0.3% (4,392) | -0.1pp |
| Korean + WWII | 0.2% (76) | 0.1% (1,875) | +0.1pp |
| Vietnam + Korean + WWII | 0.0% (12) | 0.1% (1,098) | -0.1pp |
Note: "pp" indicates percentage points. Comparisons show relative proportions of veteran populations by service era.
Note: Periods of service include World War II (Dec 1941–Dec 1946), Korean War (Jul 1950–Jan 1955), Vietnam Era (Aug 1964–Apr 1975), Gulf War (Aug 1990–Aug 2001), and Post-9/11 (Sept 2001 or later). Veterans may have served in multiple eras.
Miami-Dade County, Florida Family Poverty & Income Statistics (2023)
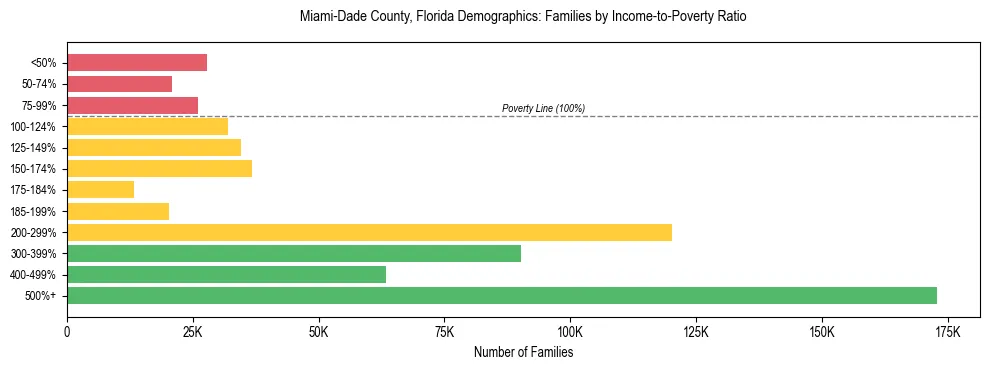
Family Economic Security Snapshot for Miami-Dade County, Florida
The following data categorizes families in Miami-Dade County, Florida by their income relative to the federal poverty threshold, based on U.S. Census Bureau 2023 ACS Estimates.
- Families Below Poverty Line (<100%)
- 11.4% (74,838 families)
- Families Near Poverty (100-199%)
- 39.1% (257,207 families)
- Families with Secure Income (200%+)
- 49.6% (326,204 families)
Poverty Rate Comparison with Florida
Compare Miami-Dade County, Florida poverty levels with Florida to understand regional economic disparities.
Poverty Rate in Miami-Dade County, Florida
11.4%
Below poverty linePoverty Rate in Florida
8.4%
Below poverty lineIncome-to-Poverty Ratio Distribution Comparison
| Income Category | Miami-Dade County, Florida | Florida | Difference |
|---|---|---|---|
| Below Poverty (<100%) | 11.4% (74,838) | 8.4% (500,062) | +3.0pp |
| Near Poverty (100-199%) | 39.1% (257,207) | 30.2% (1,785,721) | +8.9pp |
| Economic Security (200%+) | 49.6% (326,204) | 61.4% (3,636,877) | -11.8pp |
| Detailed Breakdown | |||
| Below 50% of Poverty | 4.2% | 3.9% | +0.3pp |
| 50-74% of Poverty | 3.2% | 2.0% | +1.2pp |
| 75-99% of Poverty | 3.9% | 2.6% | +1.3pp |
| 100-124% of Poverty | 4.9% | 2.9% | +2.0pp |
| 125-149% of Poverty | 5.3% | 3.4% | +1.9pp |
| 150-174% of Poverty | 5.6% | 3.8% | +1.8pp |
Note: "pp" indicates percentage points. Red badges indicate higher poverty; green badges indicate lower poverty compared to Florida.
Definition: The "Income-to-Poverty Ratio" measures a family's income against the federal poverty threshold. A ratio below 1.00 means the family is in poverty. Ratios between 1.00 and 1.99 indicate low income ("near poverty"), while ratios of 2.00 or higher suggest greater economic security.
Miami-Dade County, Florida SNAP/Food Stamps Statistics (2023)
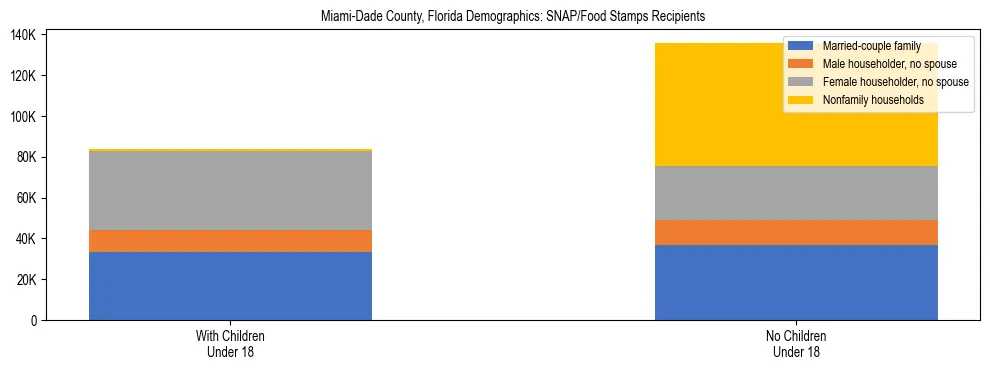
SNAP Participation Snapshot for Miami-Dade County, Florida
The following data details household participation in the Supplemental Nutrition Assistance Program (SNAP) in Miami-Dade County, Florida, based on U.S. Census Bureau 2023 ACS Estimates.
- Total Households Receiving SNAP
- 219,474 (22.75% of all households)
- Recipient Households with Children
- 83,753 (38.16% of recipients)
- Total Households Analyzed
- 964,805
SNAP Participation Comparison with Florida
Compare Miami-Dade County, Florida SNAP participation with Florida to understand regional food assistance needs.
SNAP Participation in Miami-Dade County, Florida
22.75%
219,474 householdsSNAP Participation in Florida
11.37%
1,039,823 householdsSNAP Household Composition Comparison
| Household Type | Miami-Dade County, Florida | Florida | ||
|---|---|---|---|---|
| With Children | No Children | With Children | No Children | |
| Married-Couple Family | 15.11% (33,171) | 16.79% (36,848) | 16.62% (172,821) | 12.47% (129,636) |
| Male Householder, No Spouse | 4.90% (10,757) | 5.58% (12,246) | 5.12% (53,251) | 4.19% (43,572) |
| Female Householder, No Spouse | 17.84% (39,161) | 12.13% (26,624) | 21.13% (219,699) | 10.68% (111,029) |
| Nonfamily Households | 0.30% (664) | 27.34% (60,003) | 0.44% (4,529) | 29.36% (305,286) |
| Total SNAP Recipients | 219,474 (22.75% of households) | 1,039,823 (11.37% of households) | ||
Note: Percentages represent the share of SNAP-receiving households in each category. Higher percentages in households with children often indicate targeting of families with greater nutritional needs.
About this data: The Supplemental Nutrition Assistance Program (SNAP) provides food assistance to low-income families. Households with children often face higher participation rates due to eligibility guidelines prioritizing child nutrition. "Nonfamily households" typically refer to individuals living alone or with unrelated roommates.