Alabama Age & Gender Distribution (2024)
Population distribution by age and gender for Alabama
Alabama Age & Gender Statistics (2024)
Total Population
5,086,768
Median Age
39.3
Male Median
38.0
Female Median
40.6
Alabama Population Growth
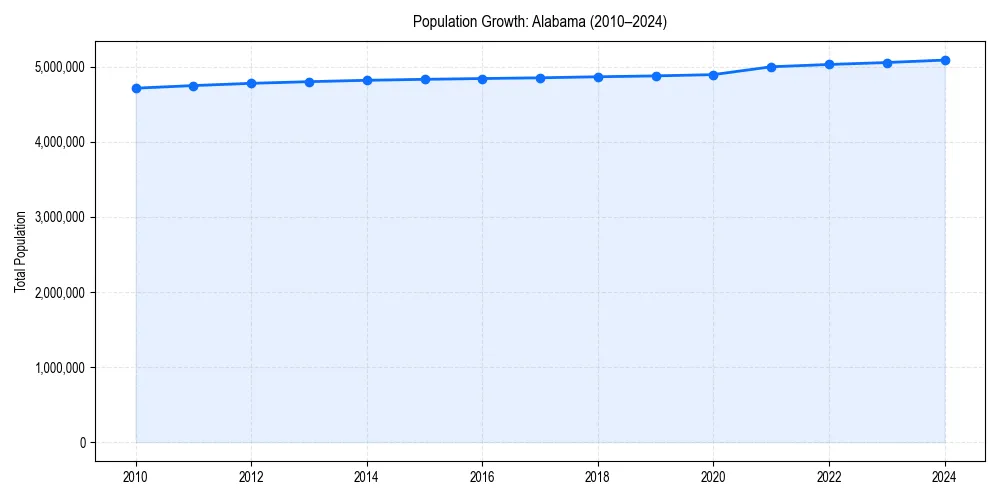
Alabama Demographic Trend
Since 2010, the population of has changed by +7.9%%.
+7.9%% Growth
Alabama Age & Gender Pyramid
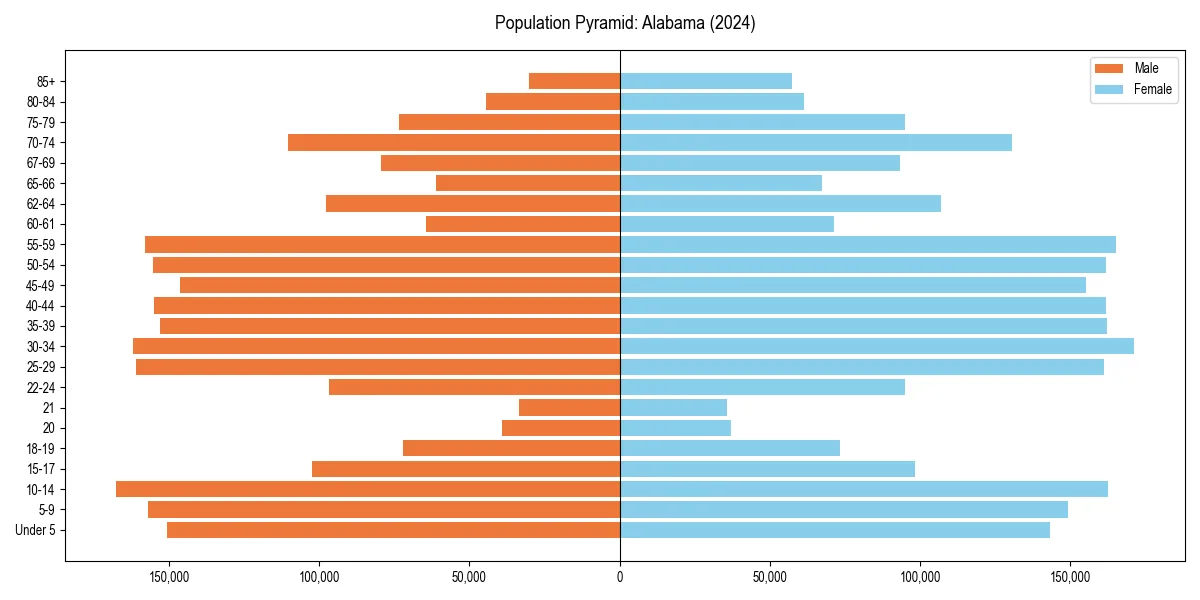
Figure 2: Population distribution by age and gender for 2024.
Alabama Historical Population Data
| Year | Median Age | Population |
|---|---|---|
| 2024 | 39.3 | 5,086,768 |
| 2023 | 39.3 | 5,054,253 |
| 2022 | 39.3 | 5,028,092 |
| 2021 | 39.3 | 4,997,675 |
| 2020 | 39.2 | 4,893,186 |
| 2019 | 39.0 | 4,876,250 |
| 2018 | 38.9 | 4,864,680 |
| 2017 | 38.7 | 4,850,771 |
| 2016 | 38.6 | 4,841,164 |
| 2015 | 38.4 | 4,830,620 |
| 2014 | 38.2 | 4,817,678 |
| 2013 | 38.1 | 4,799,277 |
| 2012 | 37.8 | 4,777,326 |
| 2011 | 37.7 | 4,747,424 |
| 2010 | 37.5 | 4,712,651 |
Alabama Age Group Breakdown (2024)
| Age Cohort | Percentage |
|---|---|
| Under 5 | 5.8% |
| 5–17 | 16.5% |
| 18–24 | 9.5% |
| 25–34 | 12.9% |
| 35–54 | 24.6% |
| 55–64 | 13.0% |
| 65+ | 17.8% |
Dependency Ratios for Alabama
- Total Dependency Ratio:
- 66.7
- Youth Dependency:
- 37.1
- Old-Age Dependency:
- 29.6
The dependency ratio measures dependents (ages 0-17 and 65+) per 100 working-age individuals (ages 18-64).
Age & Gender FAQs for Alabama
The median age in Alabama is 39.3 years.
According to latest Census data, the total population of Alabama is 5,086,768.
In Alabama, seniors (ages 65+) make up 17.8% of the population, while children under 18 represent 16.5%.
Based on historical data since 2010, the population in Alabama is aging.