California Age & Gender Distribution (2024)
Population distribution by age and gender for California
California Age & Gender Statistics (2024)
Total Population
39,287,377
Median Age
37.9
Male Median
37.0
Female Median
38.8
California Population Growth
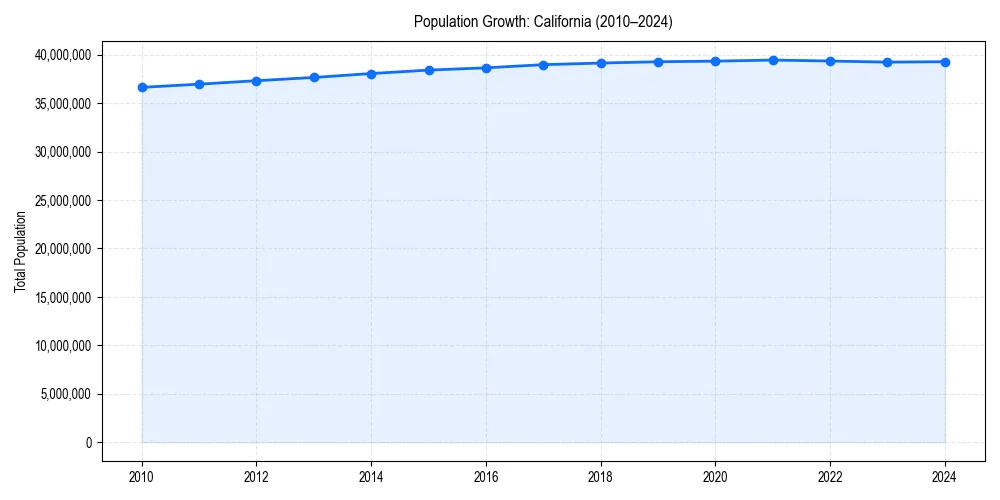
California Demographic Trend
Since 2010, the population of has changed by +7.2%%.
+7.2%% Growth
California Age & Gender Pyramid
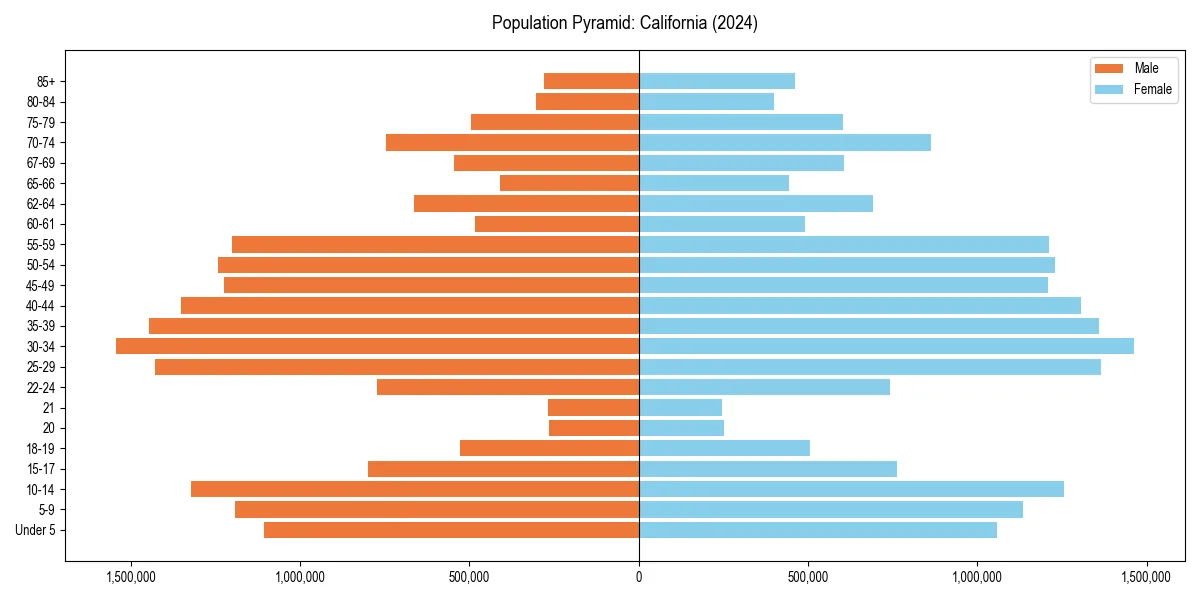
Figure 2: Population distribution by age and gender for 2024.
California Historical Population Data
| Year | Median Age | Population |
|---|---|---|
| 2024 | 37.9 | 39,287,377 |
| 2023 | 37.6 | 39,242,785 |
| 2022 | 37.3 | 39,356,104 |
| 2021 | 37.0 | 39,455,353 |
| 2020 | 36.7 | 39,346,023 |
| 2019 | 36.5 | 39,283,497 |
| 2018 | 36.3 | 39,148,760 |
| 2017 | 36.1 | 38,982,847 |
| 2016 | 36.0 | 38,654,206 |
| 2015 | 35.8 | 38,421,464 |
| 2014 | 35.6 | 38,066,920 |
| 2013 | 35.4 | 37,659,181 |
| 2012 | 35.2 | 37,325,068 |
| 2011 | 35.1 | 36,969,200 |
| 2010 | 34.9 | 36,637,290 |
California Age Group Breakdown (2024)
| Age Cohort | Percentage |
|---|---|
| Under 5 | 5.5% |
| 5–17 | 16.5% |
| 18–24 | 9.1% |
| 25–34 | 14.8% |
| 35–54 | 26.4% |
| 55–64 | 12.1% |
| 65+ | 15.7% |
Dependency Ratios for California
- Total Dependency Ratio:
- 60.4
- Youth Dependency:
- 35.2
- Old-Age Dependency:
- 25.1
The dependency ratio measures dependents (ages 0-17 and 65+) per 100 working-age individuals (ages 18-64).
Age & Gender FAQs for California
The median age in California is 37.9 years.
According to latest Census data, the total population of California is 39,287,377.
In California, seniors (ages 65+) make up 15.7% of the population, while children under 18 represent 16.5%.
Based on historical data since 2010, the population in California is aging.