Alameda County, California Nativity & Citizenship Status (2024)
Place of birth and citizenship status analysis for Alameda County, California
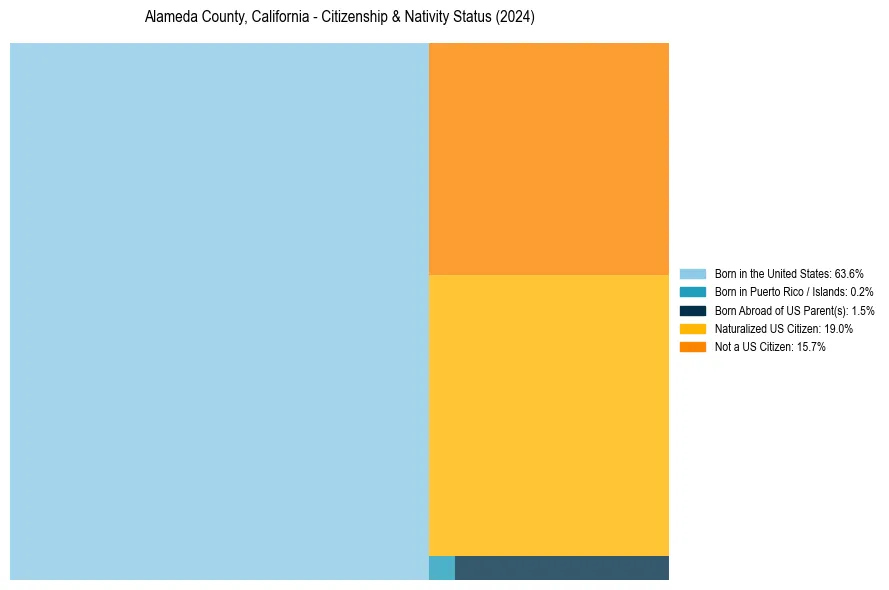
Alameda County, California Nativity & Citizenship Indicators (2024)
Native Born
65.3%
Foreign Born
34.7%
Naturalized
19.0%
US Citizens
84.3%
Alameda County, California Nativity & Citizenship Distribution
Alameda County, California Historical Nativity Trends (2010–2024)
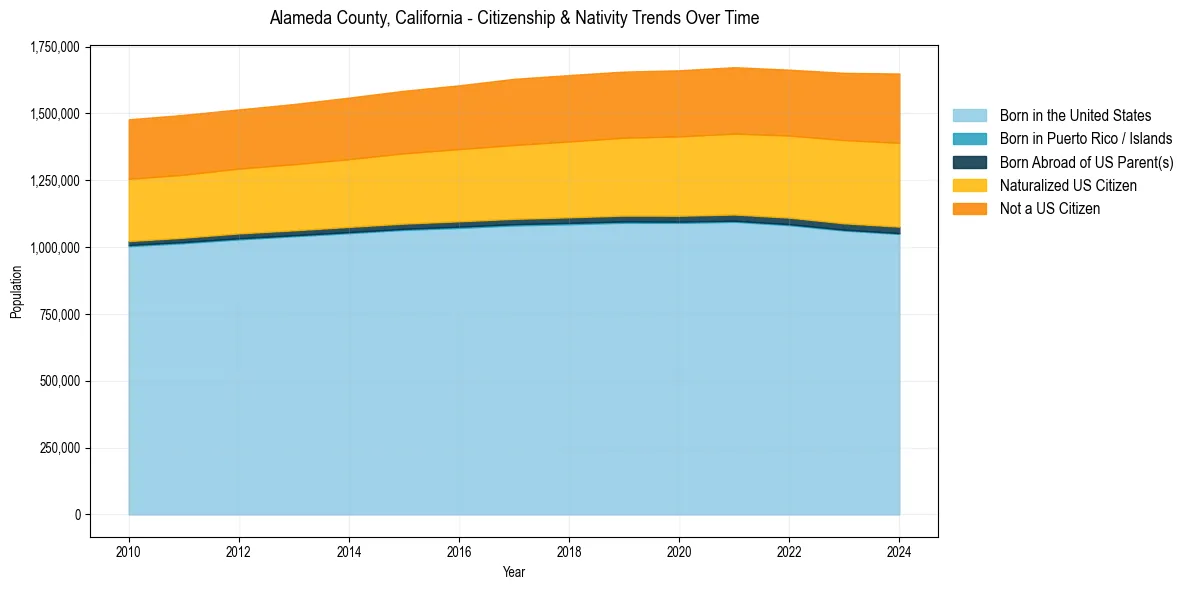
Alameda County, California Population & Nativity History
| Year | Total Pop | Foreign Born | Native Born |
|---|---|---|---|
| 2024 | 1,649,473 | 34.7% | 65.3% |
| 2023 | 1,651,949 | 34.1% | 65.9% |
| 2022 | 1,663,823 | 33.3% | 66.7% |
| 2021 | 1,673,133 | 32.9% | 67.1% |
| 2020 | 1,661,584 | 32.8% | 67.2% |
| 2019 | 1,656,754 | 32.5% | 67.5% |
| 2018 | 1,643,700 | 32.4% | 67.6% |
| 2017 | 1,629,615 | 32.1% | 67.9% |
| 2016 | 1,605,217 | 31.7% | 68.3% |
| 2015 | 1,584,983 | 31.4% | 68.6% |
| 2014 | 1,559,308 | 31.0% | 69.0% |
| 2013 | 1,535,248 | 30.8% | 69.2% |
| 2012 | 1,515,136 | 30.6% | 69.4% |
| 2011 | 1,494,876 | 30.7% | 69.3% |
| 2010 | 1,477,980 | 30.8% | 69.2% |
Nativity & Citizenship FAQs for Alameda County, California
Approximately 34.7% of residents in Alameda County, California were born outside the United States.
The vast majority of residents, roughly 84.3%, are U.S. citizens (including both native-born and naturalized citizens).