Butte County, California Nativity & Citizenship Status (2024)
Place of birth and citizenship status analysis for Butte County, California
Butte County, California Nativity & Citizenship Indicators (2024)
Native Born
91.4%
Foreign Born
8.6%
Naturalized
4.4%
US Citizens
95.8%
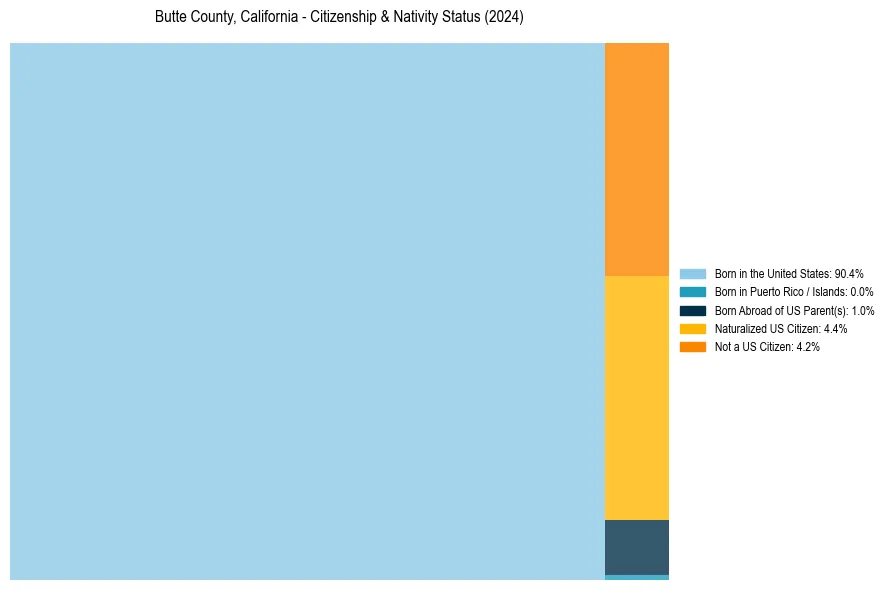
Butte County, California Nativity & Citizenship Distribution
Butte County, California Historical Nativity Trends (2010–2024)
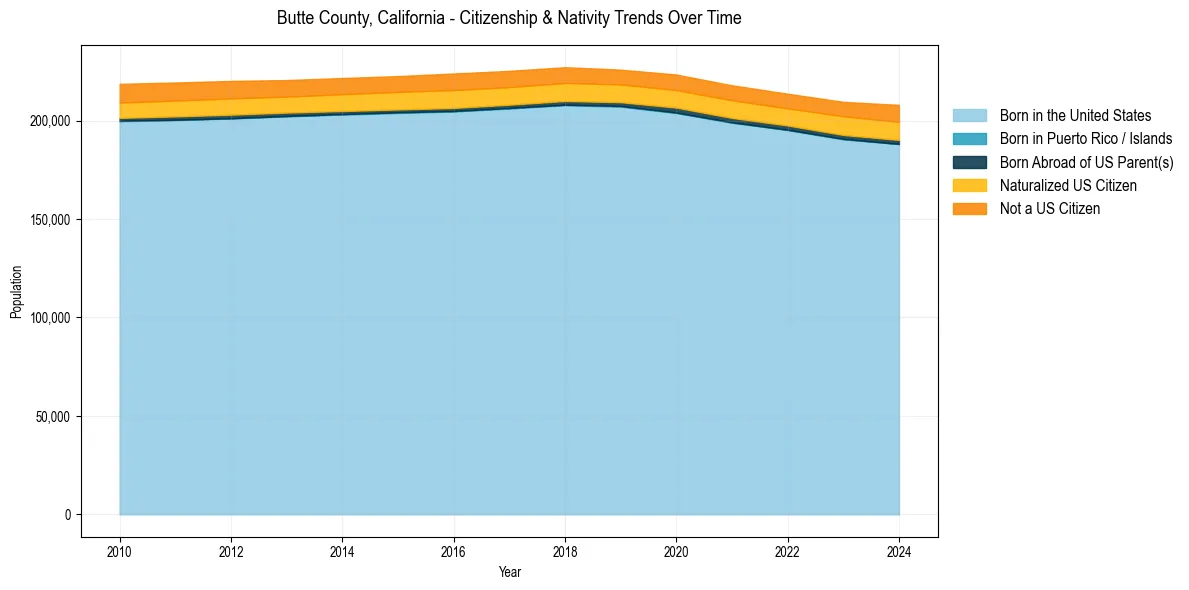
Butte County, California Population & Nativity History
| Year | Total Pop | Foreign Born | Native Born |
|---|---|---|---|
| 2024 | 207,929 | 8.6% | 91.4% |
| 2023 | 209,470 | 8.0% | 92.0% |
| 2022 | 213,605 | 7.6% | 92.4% |
| 2021 | 217,884 | 7.6% | 92.4% |
| 2020 | 223,344 | 7.5% | 92.5% |
| 2019 | 225,817 | 7.3% | 92.7% |
| 2018 | 227,075 | 7.6% | 92.4% |
| 2017 | 225,207 | 7.6% | 92.4% |
| 2016 | 223,877 | 7.8% | 92.2% |
| 2015 | 222,564 | 7.6% | 92.4% |
| 2014 | 221,578 | 7.6% | 92.4% |
| 2013 | 220,542 | 7.5% | 92.5% |
| 2012 | 220,101 | 7.8% | 92.2% |
| 2011 | 219,309 | 7.9% | 92.1% |
| 2010 | 218,635 | 7.9% | 92.1% |
Nativity & Citizenship FAQs for Butte County, California
Approximately 8.6% of residents in Butte County, California were born outside the United States.
The vast majority of residents, roughly 95.8%, are U.S. citizens (including both native-born and naturalized citizens).