Calaveras County, California Nativity & Citizenship Status (2024)
Place of birth and citizenship status analysis for Calaveras County, California
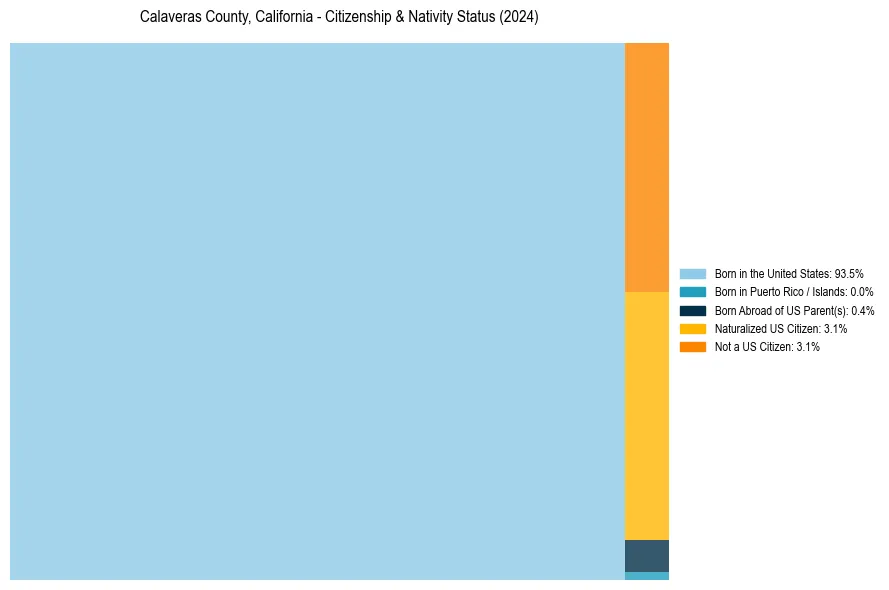
Calaveras County, California Nativity & Citizenship Indicators (2024)
Native Born
93.9%
Foreign Born
6.1%
Naturalized
3.1%
US Citizens
96.9%
Calaveras County, California Nativity & Citizenship Distribution
Calaveras County, California Historical Nativity Trends (2010–2024)
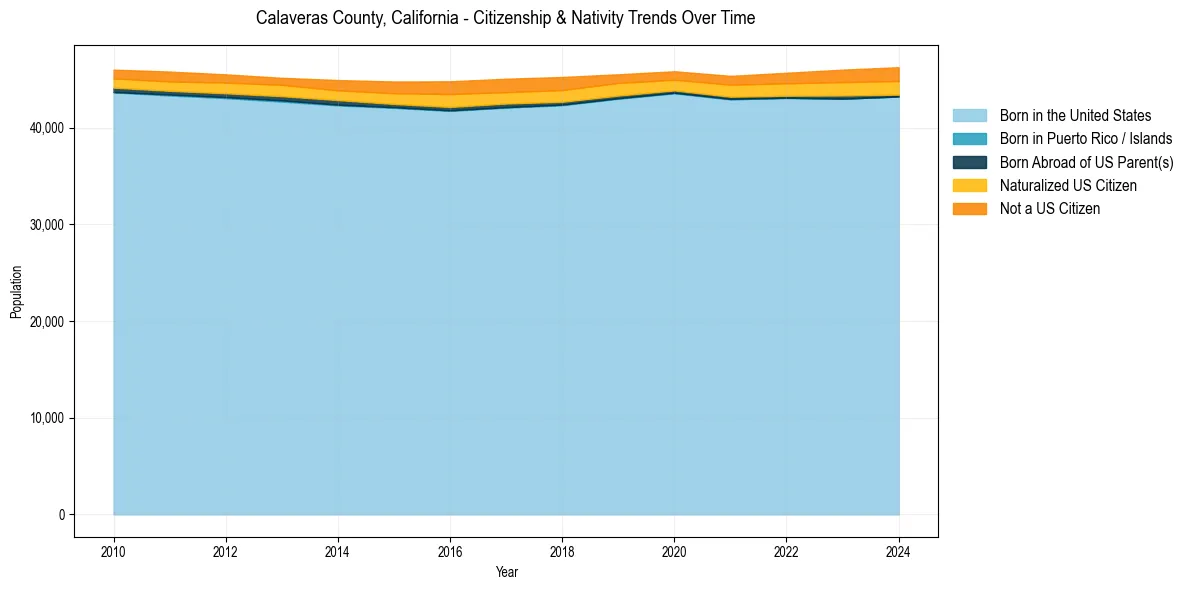
Calaveras County, California Population & Nativity History
| Year | Total Pop | Foreign Born | Native Born |
|---|---|---|---|
| 2024 | 46,248 | 6.1% | 93.9% |
| 2023 | 45,995 | 5.8% | 94.2% |
| 2022 | 45,674 | 5.2% | 94.8% |
| 2021 | 45,349 | 4.8% | 95.2% |
| 2020 | 45,828 | 4.3% | 95.7% |
| 2019 | 45,514 | 4.8% | 95.2% |
| 2018 | 45,235 | 5.7% | 94.3% |
| 2017 | 45,057 | 5.7% | 94.3% |
| 2016 | 44,787 | 5.9% | 94.1% |
| 2015 | 44,767 | 5.2% | 94.8% |
| 2014 | 44,921 | 4.6% | 95.4% |
| 2013 | 45,147 | 4.2% | 95.8% |
| 2012 | 45,507 | 4.3% | 95.7% |
| 2011 | 45,794 | 4.3% | 95.7% |
| 2010 | 45,994 | 4.1% | 95.9% |
Nativity & Citizenship FAQs for Calaveras County, California
Approximately 6.1% of residents in Calaveras County, California were born outside the United States.
The vast majority of residents, roughly 96.9%, are U.S. citizens (including both native-born and naturalized citizens).