Colusa County, California Nativity & Citizenship Status (2024)
Place of birth and citizenship status analysis for Colusa County, California
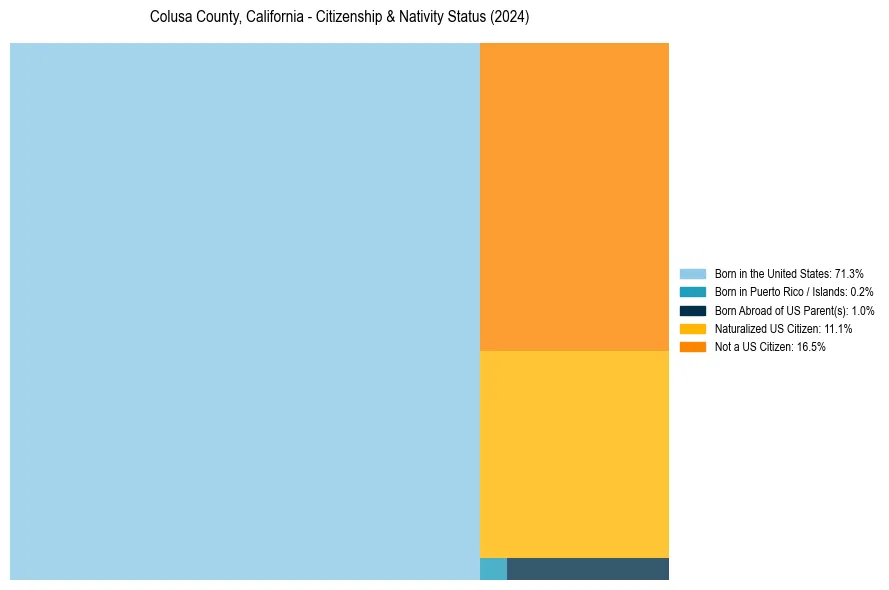
Colusa County, California Nativity & Citizenship Indicators (2024)
Native Born
72.5%
Foreign Born
27.5%
Naturalized
11.1%
US Citizens
83.5%
Colusa County, California Nativity & Citizenship Distribution
Colusa County, California Historical Nativity Trends (2010–2024)
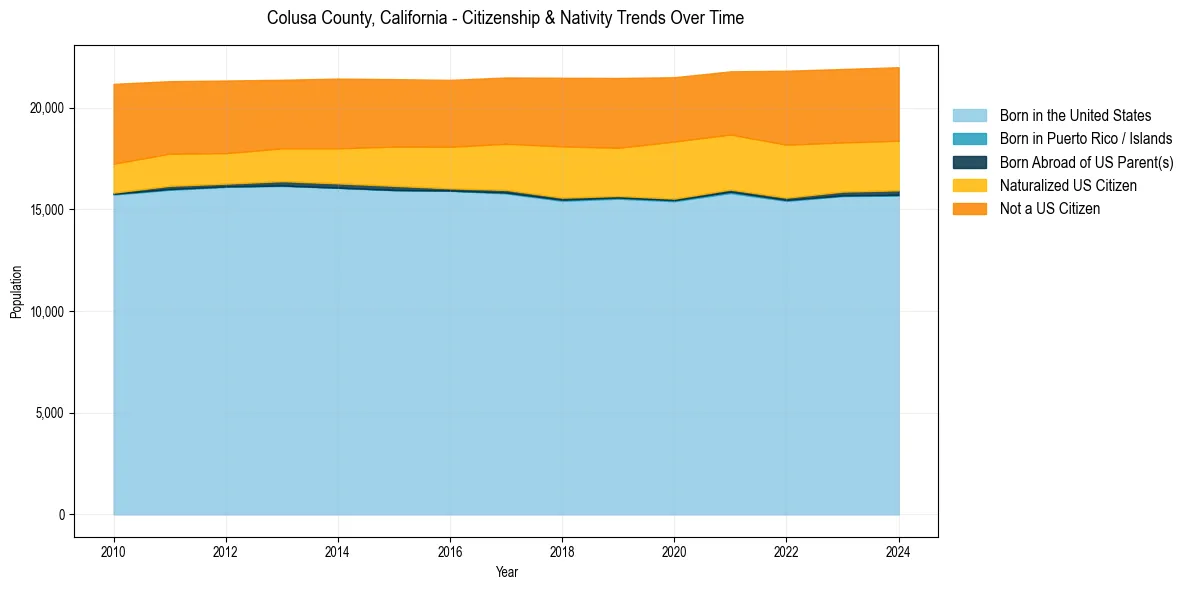
Colusa County, California Population & Nativity History
| Year | Total Pop | Foreign Born | Native Born |
|---|---|---|---|
| 2024 | 21,984 | 27.5% | 72.5% |
| 2023 | 21,895 | 27.5% | 72.5% |
| 2022 | 21,811 | 28.6% | 71.4% |
| 2021 | 21,780 | 26.7% | 73.3% |
| 2020 | 21,491 | 27.8% | 72.2% |
| 2019 | 21,454 | 27.0% | 73.0% |
| 2018 | 21,464 | 27.5% | 72.5% |
| 2017 | 21,479 | 25.7% | 74.3% |
| 2016 | 21,361 | 25.0% | 75.0% |
| 2015 | 21,396 | 24.5% | 75.5% |
| 2014 | 21,424 | 24.1% | 75.9% |
| 2013 | 21,366 | 23.3% | 76.7% |
| 2012 | 21,329 | 23.8% | 76.2% |
| 2011 | 21,297 | 24.2% | 75.8% |
| 2010 | 21,165 | 25.3% | 74.7% |
Nativity & Citizenship FAQs for Colusa County, California
Approximately 27.5% of residents in Colusa County, California were born outside the United States.
The vast majority of residents, roughly 83.5%, are U.S. citizens (including both native-born and naturalized citizens).