Contra Costa County, California Nativity & Citizenship Status (2024)
Place of birth and citizenship status analysis for Contra Costa County, California
Contra Costa County, California Nativity & Citizenship Indicators (2024)
Native Born
73.4%
Foreign Born
26.6%
Naturalized
15.6%
US Citizens
89.0%
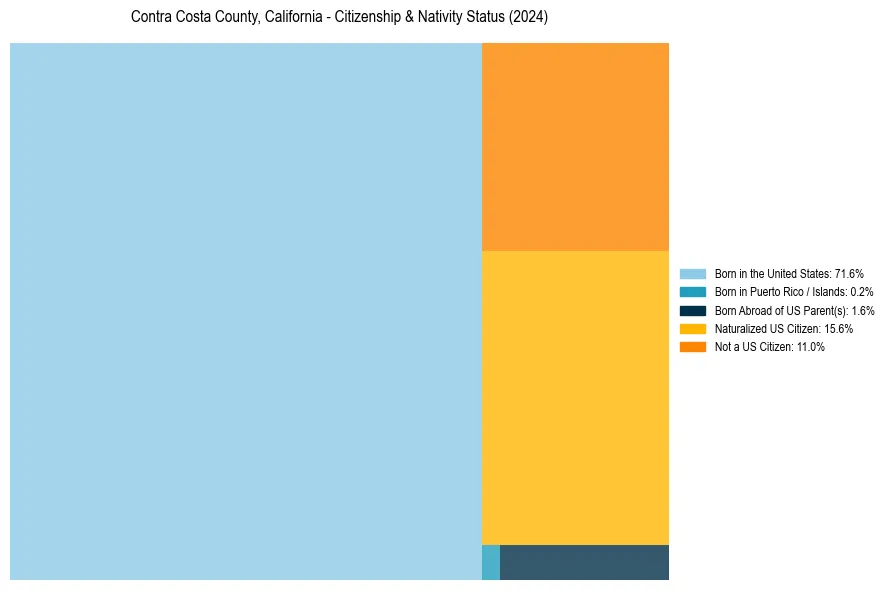
Contra Costa County, California Nativity & Citizenship Distribution
Contra Costa County, California Historical Nativity Trends (2010–2024)
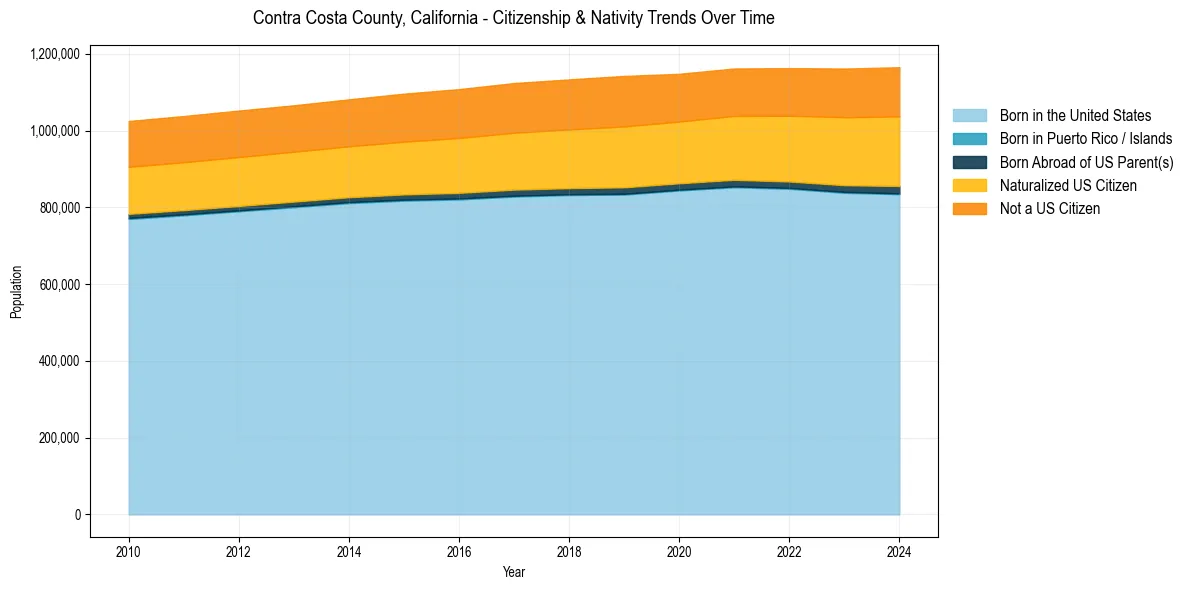
Contra Costa County, California Population & Nativity History
| Year | Total Pop | Foreign Born | Native Born |
|---|---|---|---|
| 2024 | 1,165,012 | 26.6% | 73.4% |
| 2023 | 1,161,458 | 26.2% | 73.8% |
| 2022 | 1,162,648 | 25.4% | 74.6% |
| 2021 | 1,161,643 | 25.0% | 75.0% |
| 2020 | 1,147,788 | 24.8% | 75.2% |
| 2019 | 1,142,251 | 25.4% | 74.6% |
| 2018 | 1,133,247 | 25.0% | 75.0% |
| 2017 | 1,123,678 | 24.7% | 75.3% |
| 2016 | 1,107,925 | 24.4% | 75.6% |
| 2015 | 1,096,068 | 23.9% | 76.1% |
| 2014 | 1,081,232 | 23.6% | 76.4% |
| 2013 | 1,065,794 | 23.5% | 76.5% |
| 2012 | 1,052,047 | 23.6% | 76.4% |
| 2011 | 1,037,817 | 23.6% | 76.4% |
| 2010 | 1,024,809 | 23.6% | 76.4% |
Nativity & Citizenship FAQs for Contra Costa County, California
Approximately 26.6% of residents in Contra Costa County, California were born outside the United States.
The vast majority of residents, roughly 89.0%, are U.S. citizens (including both native-born and naturalized citizens).