El Dorado County, California Nativity & Citizenship Status (2024)
Place of birth and citizenship status analysis for El Dorado County, California
El Dorado County, California Nativity & Citizenship Indicators (2024)
Native Born
90.8%
Foreign Born
9.2%
Naturalized
5.5%
US Citizens
96.3%
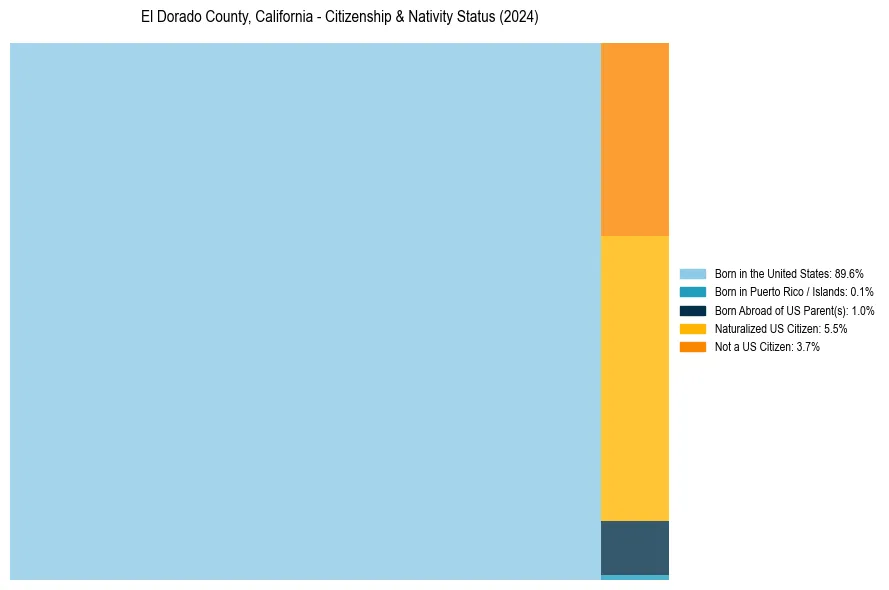
El Dorado County, California Nativity & Citizenship Distribution
El Dorado County, California Historical Nativity Trends (2010–2024)
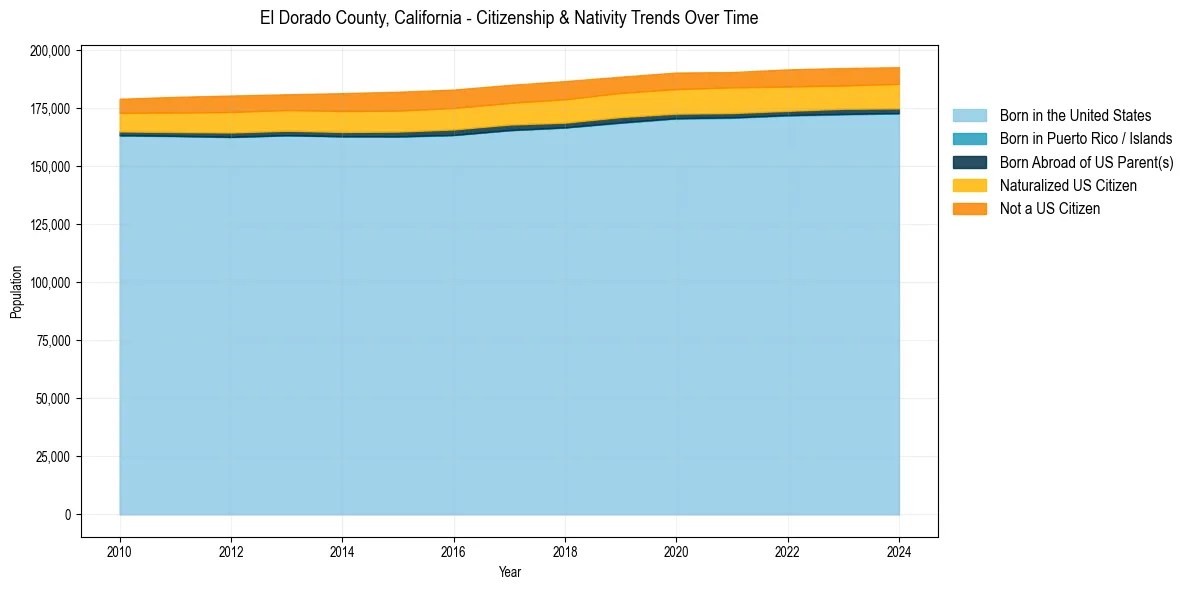
El Dorado County, California Population & Nativity History
| Year | Total Pop | Foreign Born | Native Born |
|---|---|---|---|
| 2024 | 192,662 | 9.2% | 90.8% |
| 2023 | 192,299 | 9.1% | 90.9% |
| 2022 | 191,713 | 9.3% | 90.7% |
| 2021 | 190,568 | 9.3% | 90.7% |
| 2020 | 190,345 | 9.3% | 90.7% |
| 2019 | 188,563 | 9.2% | 90.8% |
| 2018 | 186,661 | 9.6% | 90.4% |
| 2017 | 185,015 | 9.2% | 90.8% |
| 2016 | 183,000 | 9.4% | 90.6% |
| 2015 | 182,093 | 9.4% | 90.6% |
| 2014 | 181,465 | 9.2% | 90.8% |
| 2013 | 180,982 | 8.7% | 91.3% |
| 2012 | 180,441 | 8.8% | 91.2% |
| 2011 | 179,878 | 8.4% | 91.6% |
| 2010 | 179,053 | 7.9% | 92.1% |
Nativity & Citizenship FAQs for El Dorado County, California
Approximately 9.2% of residents in El Dorado County, California were born outside the United States.
The vast majority of residents, roughly 96.3%, are U.S. citizens (including both native-born and naturalized citizens).