Imperial County, California Nativity & Citizenship Status (2024)
Place of birth and citizenship status analysis for Imperial County, California
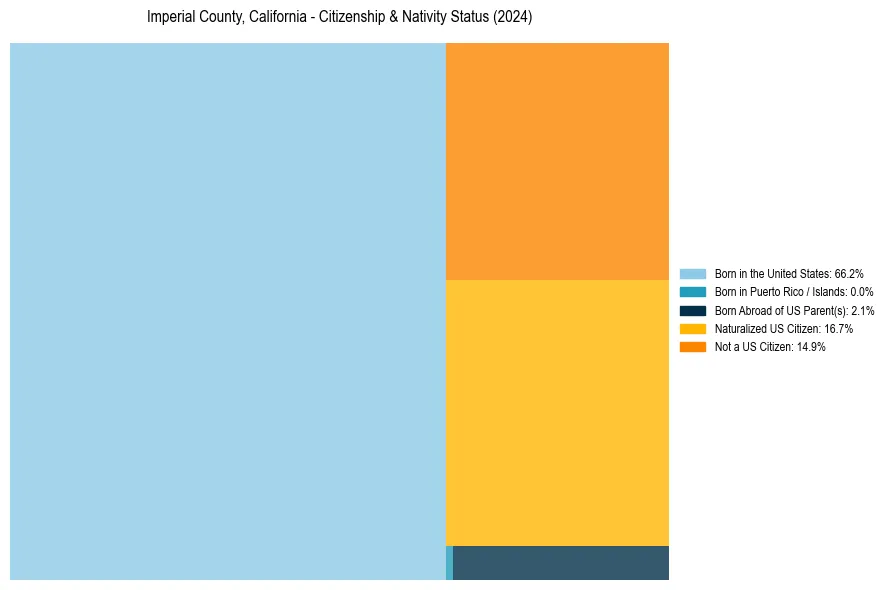
Imperial County, California Nativity & Citizenship Indicators (2024)
Native Born
68.4%
Foreign Born
31.6%
Naturalized
16.7%
US Citizens
85.1%
Imperial County, California Nativity & Citizenship Distribution
Imperial County, California Historical Nativity Trends (2010–2024)
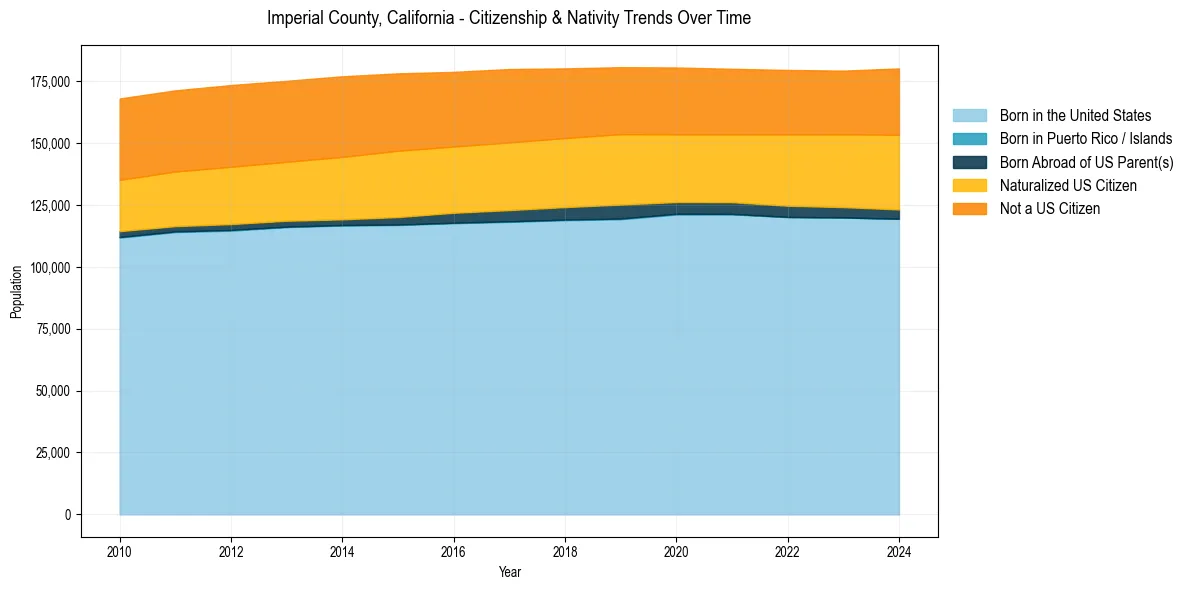
Imperial County, California Population & Nativity History
| Year | Total Pop | Foreign Born | Native Born |
|---|---|---|---|
| 2024 | 180,202 | 31.6% | 68.4% |
| 2023 | 179,319 | 30.8% | 69.2% |
| 2022 | 179,578 | 30.5% | 69.5% |
| 2021 | 180,051 | 29.9% | 70.1% |
| 2020 | 180,580 | 30.1% | 69.9% |
| 2019 | 180,701 | 30.7% | 69.3% |
| 2018 | 180,216 | 31.1% | 68.9% |
| 2017 | 179,957 | 31.7% | 68.3% |
| 2016 | 178,807 | 31.8% | 68.2% |
| 2015 | 178,206 | 32.6% | 67.4% |
| 2014 | 177,026 | 32.7% | 67.3% |
| 2013 | 175,201 | 32.3% | 67.7% |
| 2012 | 173,487 | 32.4% | 67.6% |
| 2011 | 171,343 | 32.0% | 68.0% |
| 2010 | 168,052 | 31.9% | 68.1% |
Nativity & Citizenship FAQs for Imperial County, California
Approximately 31.6% of residents in Imperial County, California were born outside the United States.
The vast majority of residents, roughly 85.1%, are U.S. citizens (including both native-born and naturalized citizens).