Inyo County, California Nativity & Citizenship Status (2024)
Place of birth and citizenship status analysis for Inyo County, California
Inyo County, California Nativity & Citizenship Indicators (2024)
Native Born
92.1%
Foreign Born
7.9%
Naturalized
3.2%
US Citizens
95.3%
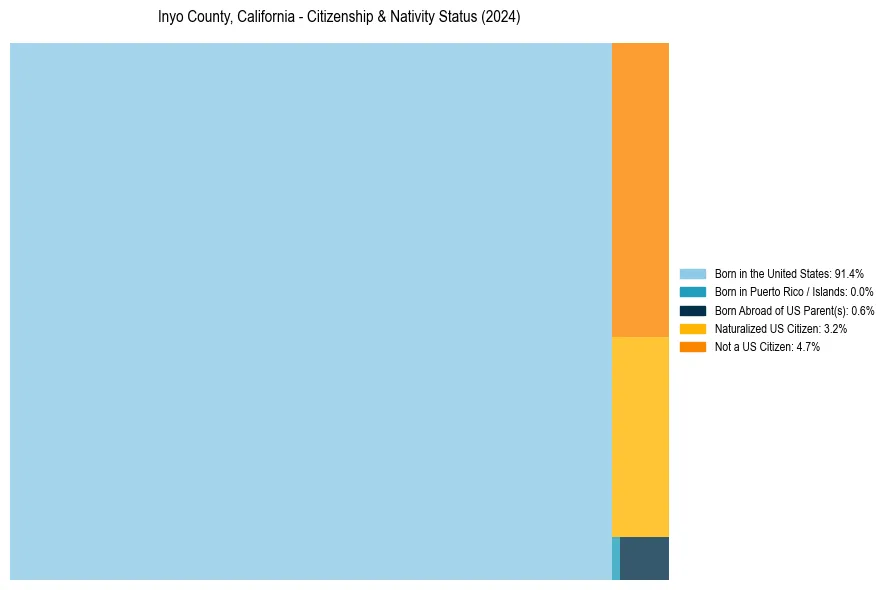
Inyo County, California Nativity & Citizenship Distribution
Inyo County, California Historical Nativity Trends (2010–2024)
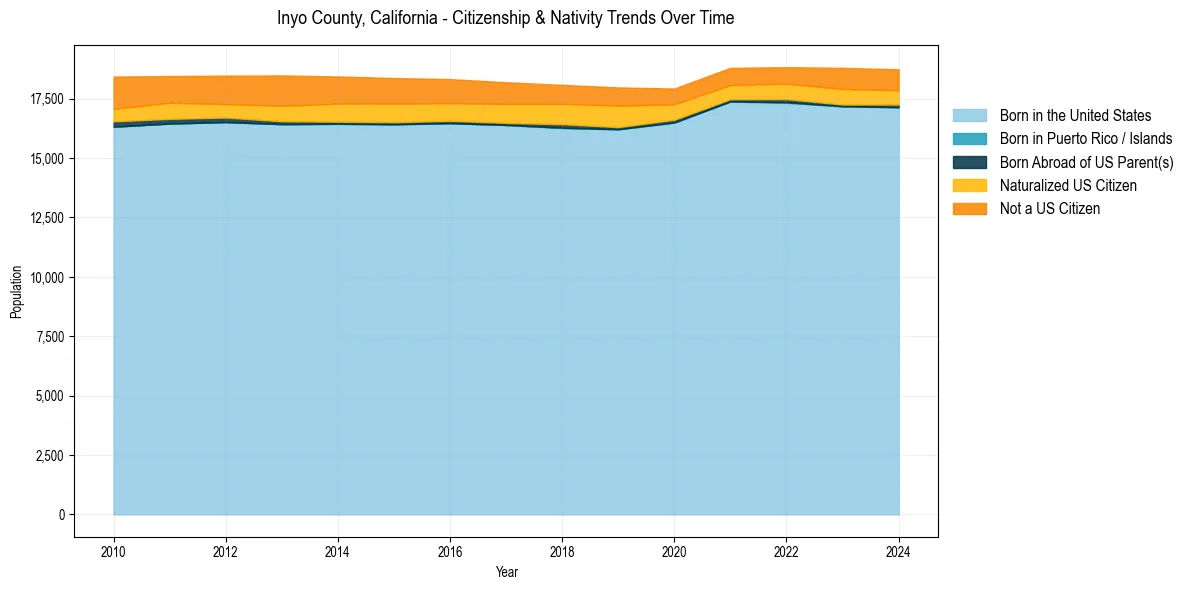
Inyo County, California Population & Nativity History
| Year | Total Pop | Foreign Born | Native Born |
|---|---|---|---|
| 2024 | 18,739 | 7.9% | 92.1% |
| 2023 | 18,803 | 8.2% | 91.8% |
| 2022 | 18,829 | 7.1% | 92.9% |
| 2021 | 18,804 | 7.0% | 93.0% |
| 2020 | 17,930 | 7.3% | 92.7% |
| 2019 | 17,977 | 9.3% | 90.7% |
| 2018 | 18,085 | 9.2% | 90.8% |
| 2017 | 18,195 | 9.4% | 90.6% |
| 2016 | 18,326 | 9.6% | 90.4% |
| 2015 | 18,373 | 10.1% | 89.9% |
| 2014 | 18,439 | 10.3% | 89.7% |
| 2013 | 18,482 | 10.4% | 89.6% |
| 2012 | 18,474 | 9.6% | 90.4% |
| 2011 | 18,457 | 9.8% | 90.2% |
| 2010 | 18,434 | 10.2% | 89.8% |
Nativity & Citizenship FAQs for Inyo County, California
Approximately 7.9% of residents in Inyo County, California were born outside the United States.
The vast majority of residents, roughly 95.3%, are U.S. citizens (including both native-born and naturalized citizens).