Kern County, California Nativity & Citizenship Status (2024)
Place of birth and citizenship status analysis for Kern County, California
Kern County, California Nativity & Citizenship Indicators (2024)
Native Born
79.8%
Foreign Born
20.2%
Naturalized
8.2%
US Citizens
88.0%
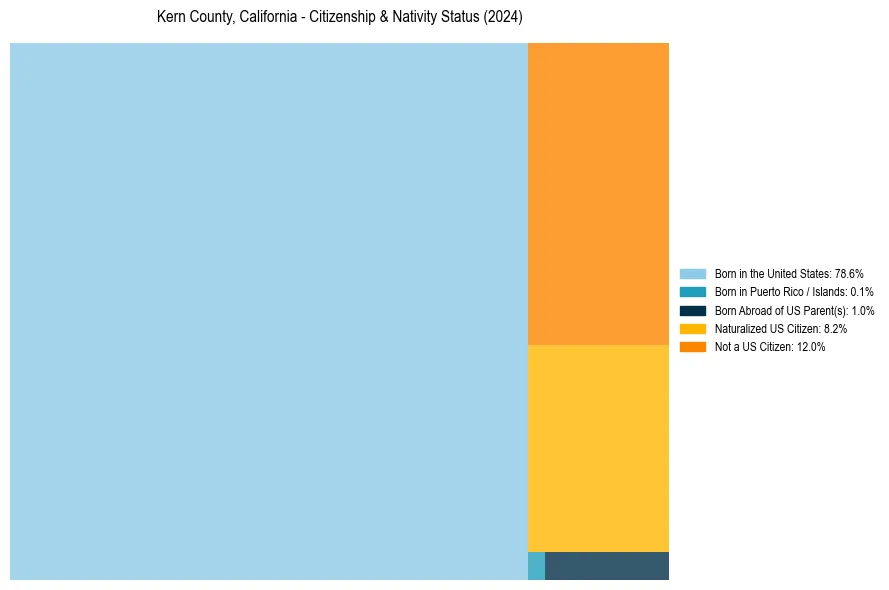
Kern County, California Nativity & Citizenship Distribution
Kern County, California Historical Nativity Trends (2010–2024)
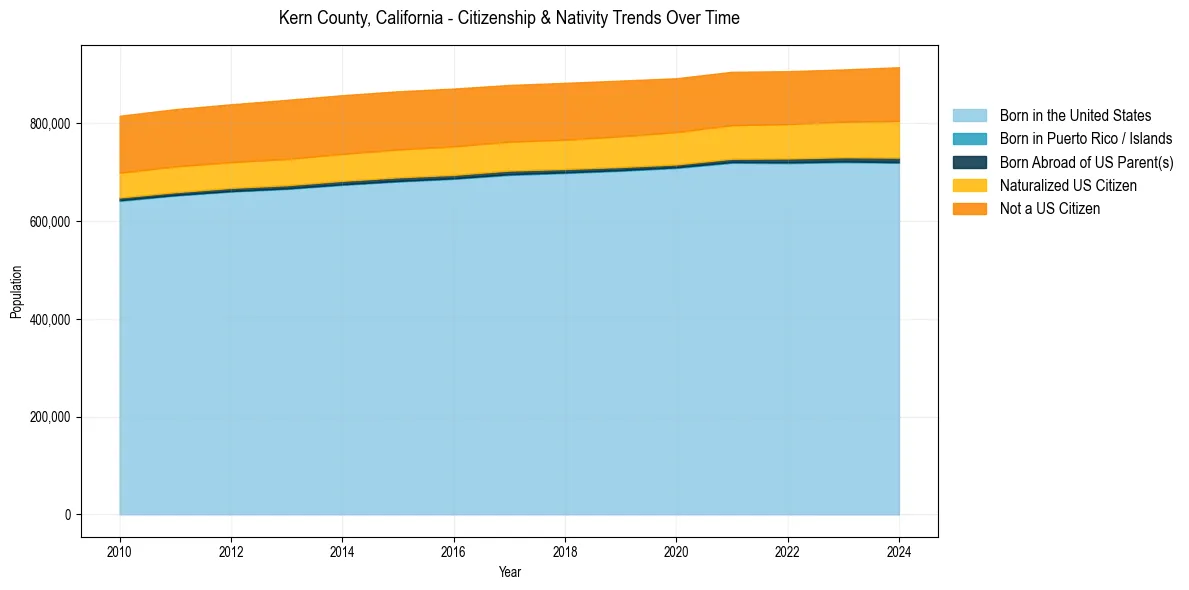
Kern County, California Population & Nativity History
| Year | Total Pop | Foreign Born | Native Born |
|---|---|---|---|
| 2024 | 915,075 | 20.2% | 79.8% |
| 2023 | 910,433 | 19.7% | 80.3% |
| 2022 | 906,883 | 19.7% | 80.3% |
| 2021 | 905,644 | 19.7% | 80.3% |
| 2020 | 892,458 | 19.8% | 80.2% |
| 2019 | 887,641 | 19.9% | 80.1% |
| 2018 | 883,053 | 20.0% | 80.0% |
| 2017 | 878,744 | 19.9% | 80.1% |
| 2016 | 871,337 | 20.3% | 79.7% |
| 2015 | 865,736 | 20.3% | 79.7% |
| 2014 | 857,730 | 20.4% | 79.6% |
| 2013 | 848,204 | 20.6% | 79.4% |
| 2012 | 839,153 | 20.4% | 79.6% |
| 2011 | 829,254 | 20.5% | 79.5% |
| 2010 | 815,693 | 20.5% | 79.5% |
Nativity & Citizenship FAQs for Kern County, California
Approximately 20.2% of residents in Kern County, California were born outside the United States.
The vast majority of residents, roughly 88.0%, are U.S. citizens (including both native-born and naturalized citizens).