Kings County, California Nativity & Citizenship Status (2024)
Place of birth and citizenship status analysis for Kings County, California
Kings County, California Nativity & Citizenship Indicators (2024)
Native Born
80.8%
Foreign Born
19.2%
Naturalized
6.6%
US Citizens
87.4%
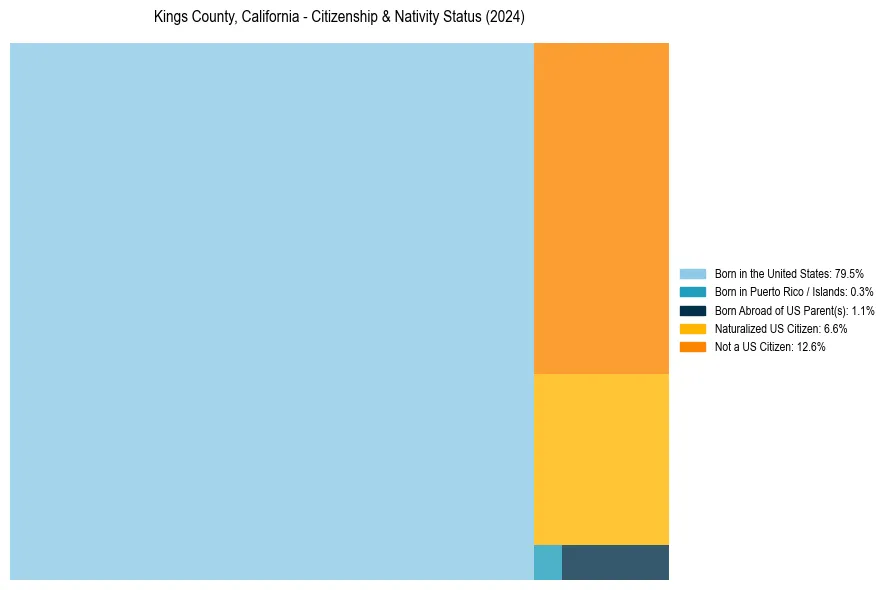
Kings County, California Nativity & Citizenship Distribution
Kings County, California Historical Nativity Trends (2010–2024)
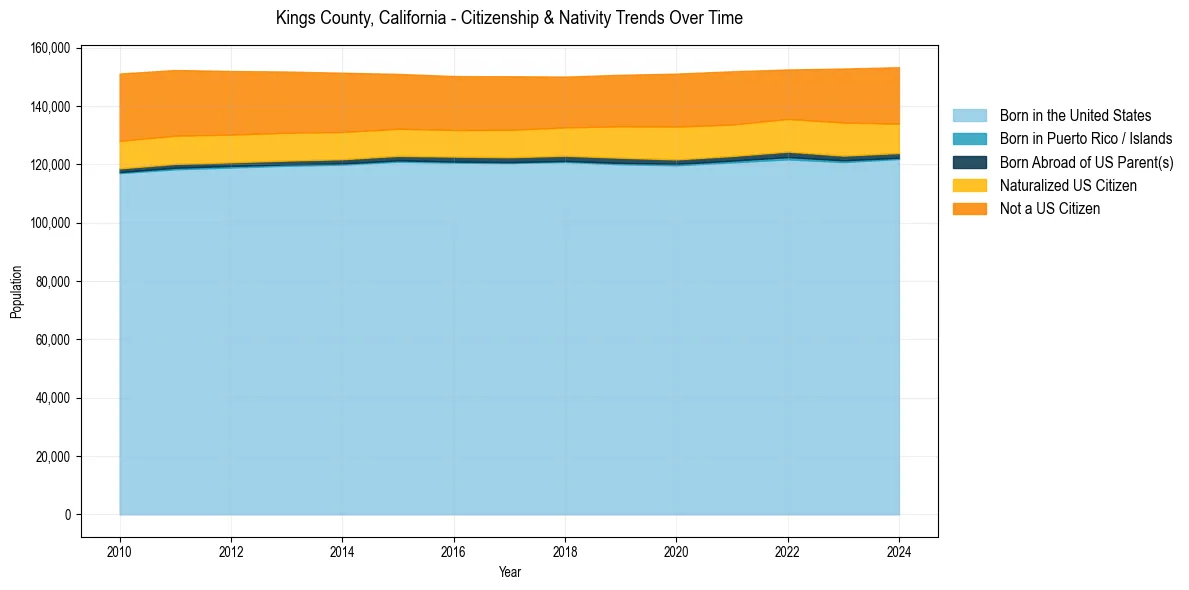
Kings County, California Population & Nativity History
| Year | Total Pop | Foreign Born | Native Born |
|---|---|---|---|
| 2024 | 153,298 | 19.2% | 80.8% |
| 2023 | 152,830 | 19.5% | 80.5% |
| 2022 | 152,515 | 18.5% | 81.5% |
| 2021 | 151,887 | 19.1% | 80.9% |
| 2020 | 151,090 | 19.5% | 80.5% |
| 2019 | 150,691 | 18.9% | 81.1% |
| 2018 | 150,075 | 18.1% | 81.9% |
| 2017 | 150,183 | 18.5% | 81.5% |
| 2016 | 150,261 | 18.4% | 81.6% |
| 2015 | 150,998 | 18.6% | 81.4% |
| 2014 | 151,390 | 19.6% | 80.4% |
| 2013 | 151,806 | 20.1% | 79.9% |
| 2012 | 151,982 | 20.6% | 79.4% |
| 2011 | 152,335 | 21.1% | 78.9% |
| 2010 | 151,122 | 21.5% | 78.5% |
Nativity & Citizenship FAQs for Kings County, California
Approximately 19.2% of residents in Kings County, California were born outside the United States.
The vast majority of residents, roughly 87.4%, are U.S. citizens (including both native-born and naturalized citizens).