Los Angeles County, California Health Insurance Coverage (2024)
Detailed analysis of uninsured rates and coverage trends for Los Angeles County, California
Universe
9,742,931
Total Uninsured
800,248
Uninsured Rate
8.2%
Coverage by Age and Gender
Distribution of insured vs. uninsured residents in Los Angeles County, California
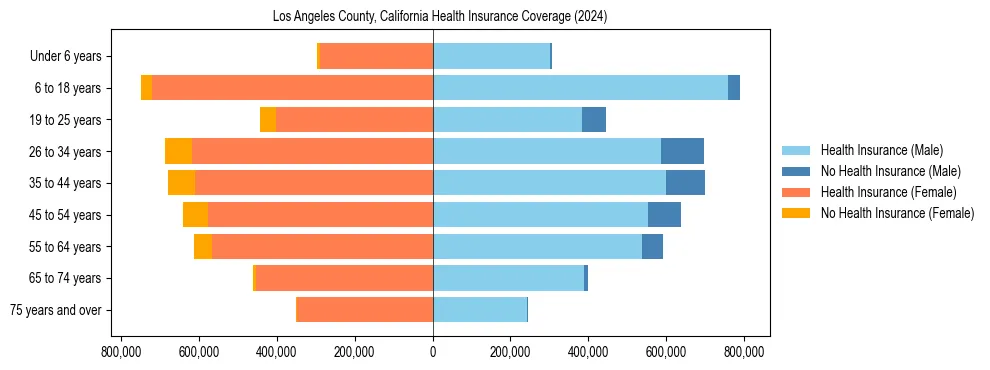
Uninsured Rates by Demographic Group
Under 18 Years
Male Uninsured3.5%
Female Uninsured3.3%
18 to 34 Years
Male Uninsured15.2%
Female Uninsured9.9%
35 to 64 Years
Male Uninsured12.4%
Female Uninsured9.3%
65 Years & Over
Male Uninsured1.8%
Female Uninsured1.4%
Uninsured Rate Trends
Historical coverage data from 2012 to 2024
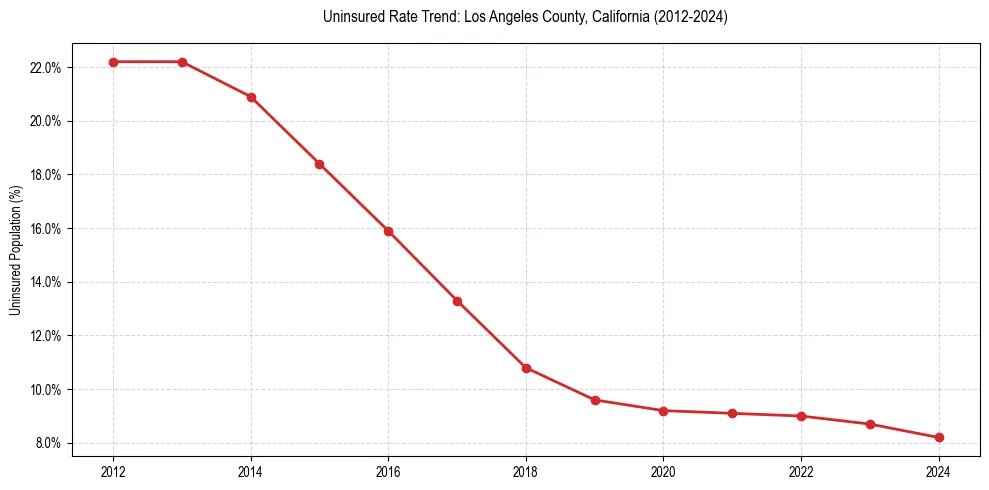
| Year | Total Uninsured | Uninsured Rate |
|---|---|---|
| 2024 | 800,248 | 8.2% |
| 2023 | 849,903 | 8.7% |
| 2022 | 888,735 | 9.0% |
| 2021 | 904,431 | 9.1% |
| 2020 | 914,046 | 9.2% |
| 2019 | 965,181 | 9.6% |
| 2018 | 1,086,657 | 10.8% |
| 2017 | 1,336,596 | 13.3% |
| 2016 | 1,585,437 | 15.9% |
| 2015 | 1,834,501 | 18.4% |
| 2014 | 2,064,765 | 20.9% |
| 2013 | 2,177,718 | 22.2% |
| 2012 | 2,168,228 | 22.2% |
Frequently Asked Questions
Approximately 8.2% of the population in Los Angeles County, California does not have health insurance coverage.
In Los Angeles County, California, young adult males (18-34) face the highest barrier to coverage, with an uninsured rate of 15.2%. This is notably higher than the overall local average of 8.2%.