Los Angeles County, California Nativity & Citizenship Status (2024)
Place of birth and citizenship status analysis for Los Angeles County, California
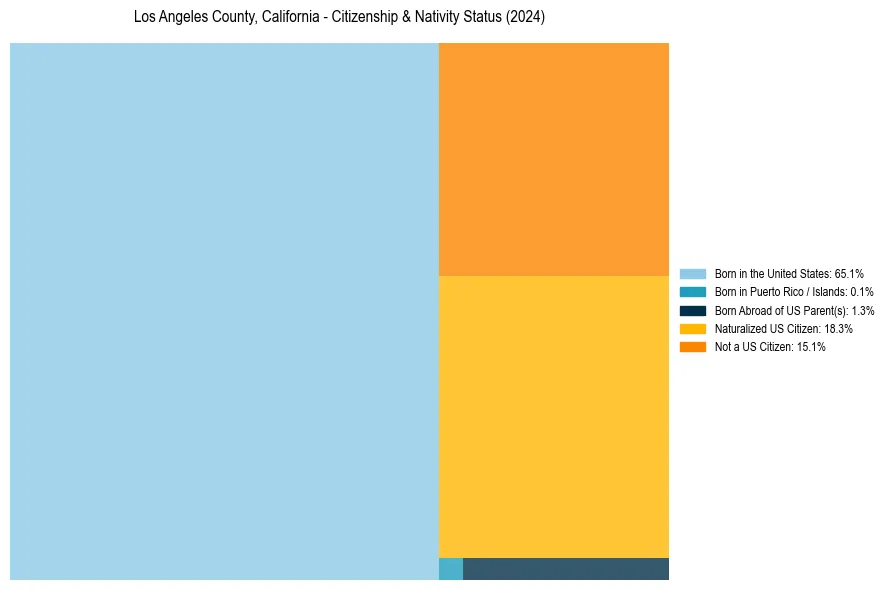
Los Angeles County, California Nativity & Citizenship Indicators (2024)
Native Born
66.6%
Foreign Born
33.4%
Naturalized
18.3%
US Citizens
84.9%
Los Angeles County, California Nativity & Citizenship Distribution
Los Angeles County, California Historical Nativity Trends (2010–2024)
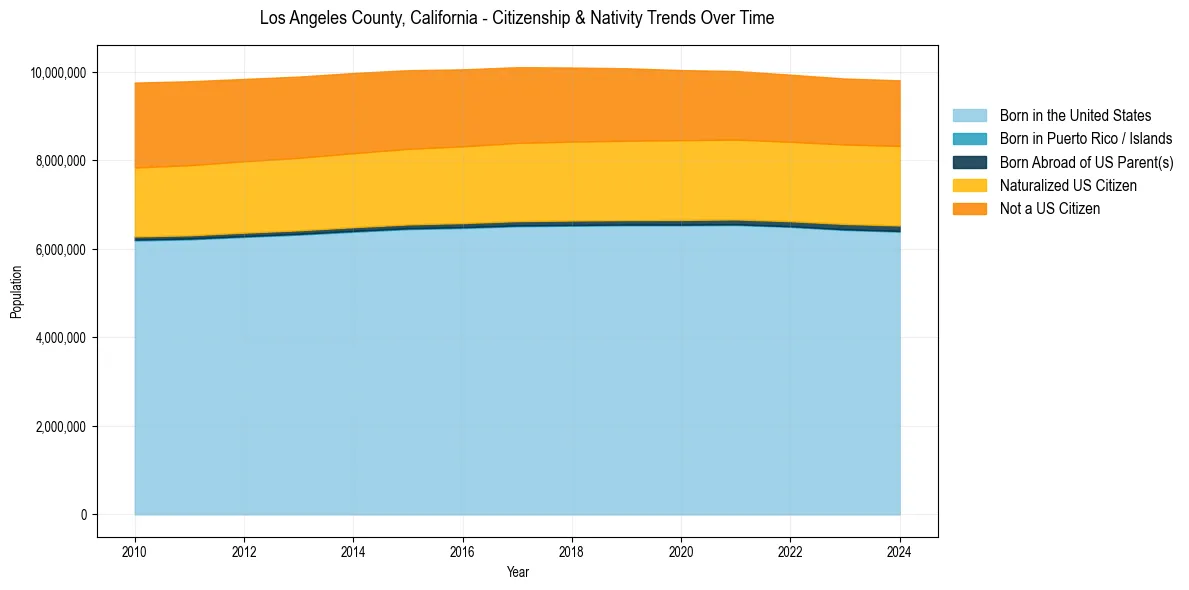
Los Angeles County, California Population & Nativity History
| Year | Total Pop | Foreign Born | Native Born |
|---|---|---|---|
| 2024 | 9,808,667 | 33.4% | 66.6% |
| 2023 | 9,848,406 | 33.4% | 66.6% |
| 2022 | 9,936,690 | 33.3% | 66.7% |
| 2021 | 10,019,635 | 33.5% | 66.5% |
| 2020 | 10,040,682 | 33.7% | 66.3% |
| 2019 | 10,081,570 | 34.0% | 66.0% |
| 2018 | 10,098,052 | 34.2% | 65.8% |
| 2017 | 10,105,722 | 34.4% | 65.6% |
| 2016 | 10,057,155 | 34.5% | 65.5% |
| 2015 | 10,038,388 | 34.7% | 65.3% |
| 2014 | 9,974,203 | 34.9% | 65.1% |
| 2013 | 9,893,481 | 35.1% | 64.9% |
| 2012 | 9,840,024 | 35.3% | 64.7% |
| 2011 | 9,787,747 | 35.6% | 64.4% |
| 2010 | 9,758,256 | 35.6% | 64.4% |
Nativity & Citizenship FAQs for Los Angeles County, California
Approximately 33.4% of residents in Los Angeles County, California were born outside the United States.
The vast majority of residents, roughly 84.9%, are U.S. citizens (including both native-born and naturalized citizens).