Madera County, California Nativity & Citizenship Status (2024)
Place of birth and citizenship status analysis for Madera County, California
Madera County, California Nativity & Citizenship Indicators (2024)
Native Born
79.9%
Foreign Born
20.1%
Naturalized
7.2%
US Citizens
87.1%
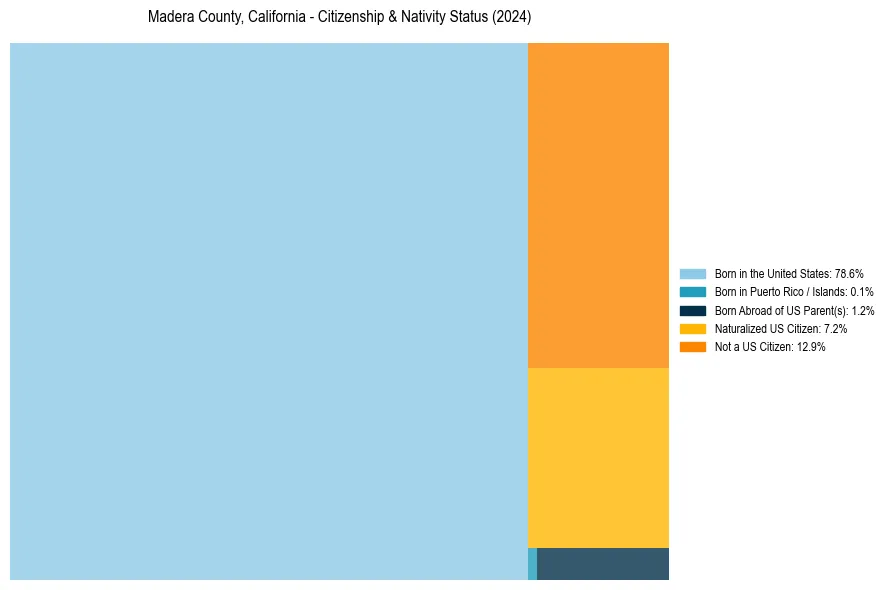
Madera County, California Nativity & Citizenship Distribution
Madera County, California Historical Nativity Trends (2010–2024)
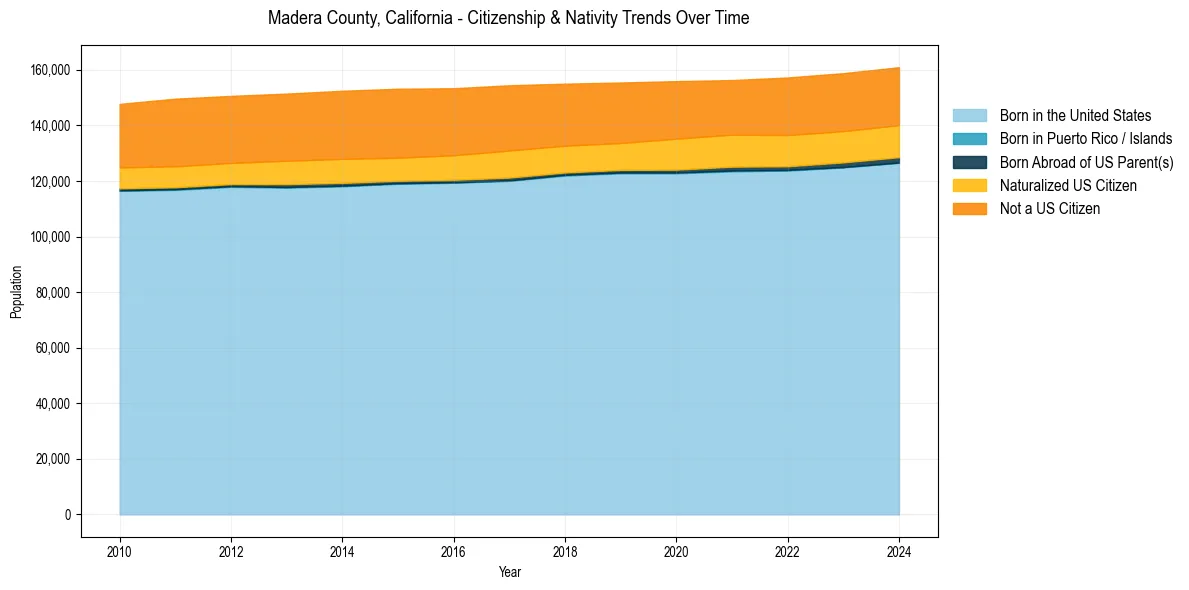
Madera County, California Population & Nativity History
| Year | Total Pop | Foreign Born | Native Born |
|---|---|---|---|
| 2024 | 160,940 | 20.1% | 79.9% |
| 2023 | 158,790 | 20.2% | 79.8% |
| 2022 | 157,243 | 20.3% | 79.7% |
| 2021 | 156,304 | 19.9% | 80.1% |
| 2020 | 155,925 | 20.4% | 79.6% |
| 2019 | 155,433 | 20.2% | 79.8% |
| 2018 | 155,013 | 20.6% | 79.4% |
| 2017 | 154,440 | 21.5% | 78.5% |
| 2016 | 153,366 | 21.5% | 78.5% |
| 2015 | 153,187 | 21.6% | 78.4% |
| 2014 | 152,452 | 21.8% | 78.2% |
| 2013 | 151,435 | 21.5% | 78.5% |
| 2012 | 150,615 | 21.1% | 78.9% |
| 2011 | 149,611 | 21.3% | 78.7% |
| 2010 | 147,738 | 20.6% | 79.4% |
Nativity & Citizenship FAQs for Madera County, California
Approximately 20.1% of residents in Madera County, California were born outside the United States.
The vast majority of residents, roughly 87.1%, are U.S. citizens (including both native-born and naturalized citizens).