Marin County, California Nativity & Citizenship Status (2024)
Place of birth and citizenship status analysis for Marin County, California
Marin County, California Nativity & Citizenship Indicators (2024)
Native Born
80.4%
Foreign Born
19.6%
Naturalized
10.1%
US Citizens
90.5%
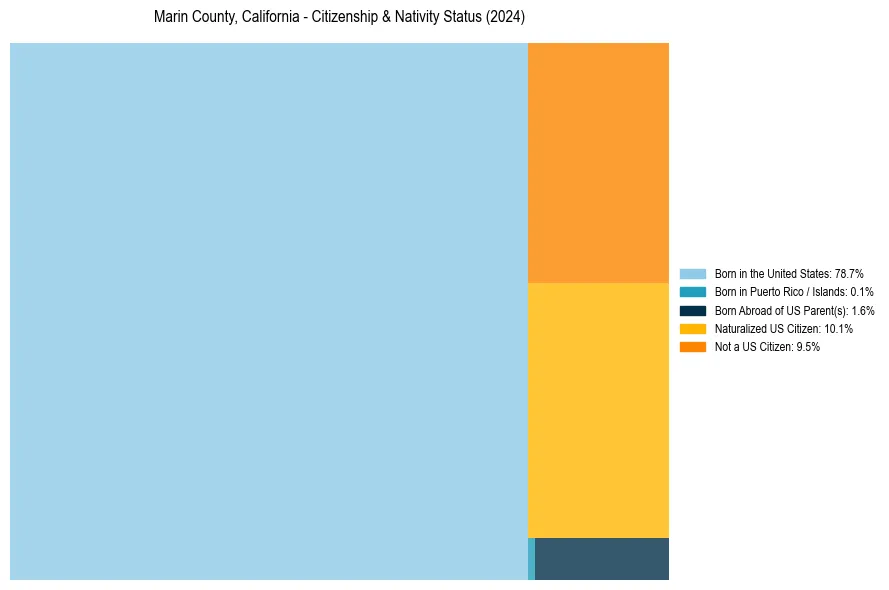
Marin County, California Nativity & Citizenship Distribution
Marin County, California Historical Nativity Trends (2010–2024)
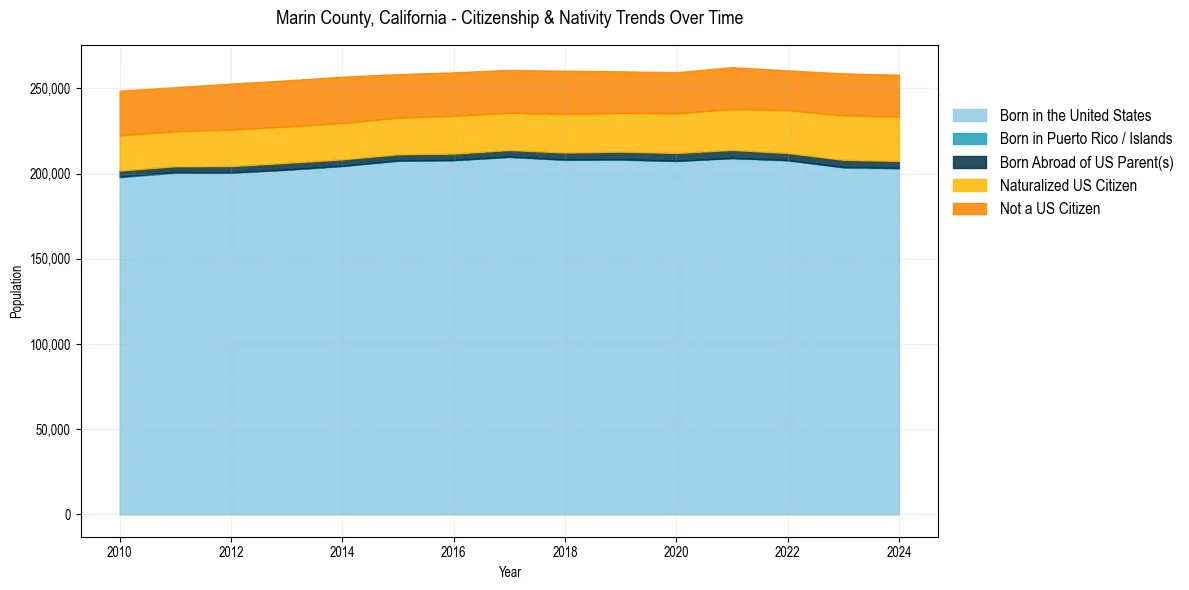
Marin County, California Population & Nativity History
| Year | Total Pop | Foreign Born | Native Born |
|---|---|---|---|
| 2024 | 257,969 | 19.6% | 80.4% |
| 2023 | 258,765 | 19.6% | 80.4% |
| 2022 | 260,485 | 18.6% | 81.4% |
| 2021 | 262,387 | 18.5% | 81.5% |
| 2020 | 259,441 | 18.3% | 81.7% |
| 2019 | 259,943 | 18.1% | 81.9% |
| 2018 | 260,295 | 18.4% | 81.6% |
| 2017 | 260,814 | 18.0% | 82.0% |
| 2016 | 259,358 | 18.4% | 81.6% |
| 2015 | 258,349 | 18.2% | 81.8% |
| 2014 | 256,802 | 18.9% | 81.1% |
| 2013 | 254,643 | 19.0% | 81.0% |
| 2012 | 252,759 | 19.1% | 80.9% |
| 2011 | 250,666 | 18.5% | 81.5% |
| 2010 | 248,601 | 18.8% | 81.2% |
Nativity & Citizenship FAQs for Marin County, California
Approximately 19.6% of residents in Marin County, California were born outside the United States.
The vast majority of residents, roughly 90.5%, are U.S. citizens (including both native-born and naturalized citizens).