Merced County, California Nativity & Citizenship Status (2024)
Place of birth and citizenship status analysis for Merced County, California
Merced County, California Nativity & Citizenship Indicators (2024)
Native Born
74.4%
Foreign Born
25.6%
Naturalized
10.8%
US Citizens
85.2%
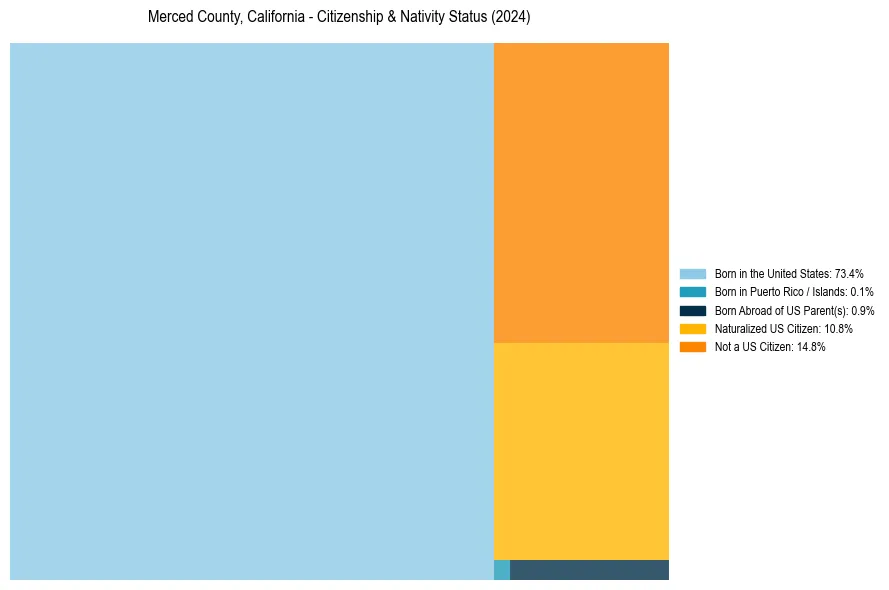
Merced County, California Nativity & Citizenship Distribution
Merced County, California Historical Nativity Trends (2010–2024)
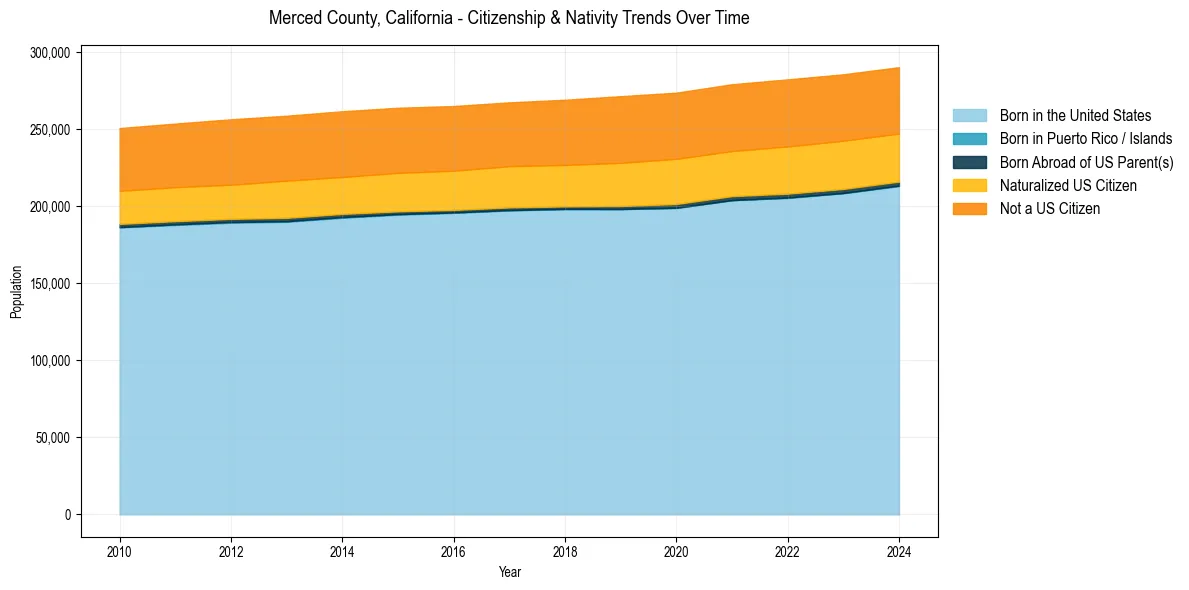
Merced County, California Population & Nativity History
| Year | Total Pop | Foreign Born | Native Born |
|---|---|---|---|
| 2024 | 290,201 | 25.6% | 74.4% |
| 2023 | 285,597 | 26.1% | 73.9% |
| 2022 | 282,290 | 26.3% | 73.7% |
| 2021 | 279,150 | 26.0% | 74.0% |
| 2020 | 273,661 | 26.4% | 73.6% |
| 2019 | 271,382 | 26.3% | 73.7% |
| 2018 | 269,075 | 25.7% | 74.3% |
| 2017 | 267,390 | 25.5% | 74.5% |
| 2016 | 265,001 | 25.4% | 74.6% |
| 2015 | 263,885 | 25.5% | 74.5% |
| 2014 | 261,609 | 25.5% | 74.5% |
| 2013 | 258,707 | 25.6% | 74.4% |
| 2012 | 256,398 | 25.2% | 74.8% |
| 2011 | 253,606 | 25.0% | 75.0% |
| 2010 | 250,699 | 24.8% | 75.2% |
Nativity & Citizenship FAQs for Merced County, California
Approximately 25.6% of residents in Merced County, California were born outside the United States.
The vast majority of residents, roughly 85.2%, are U.S. citizens (including both native-born and naturalized citizens).