Monterey County, California Nativity & Citizenship Status (2024)
Place of birth and citizenship status analysis for Monterey County, California
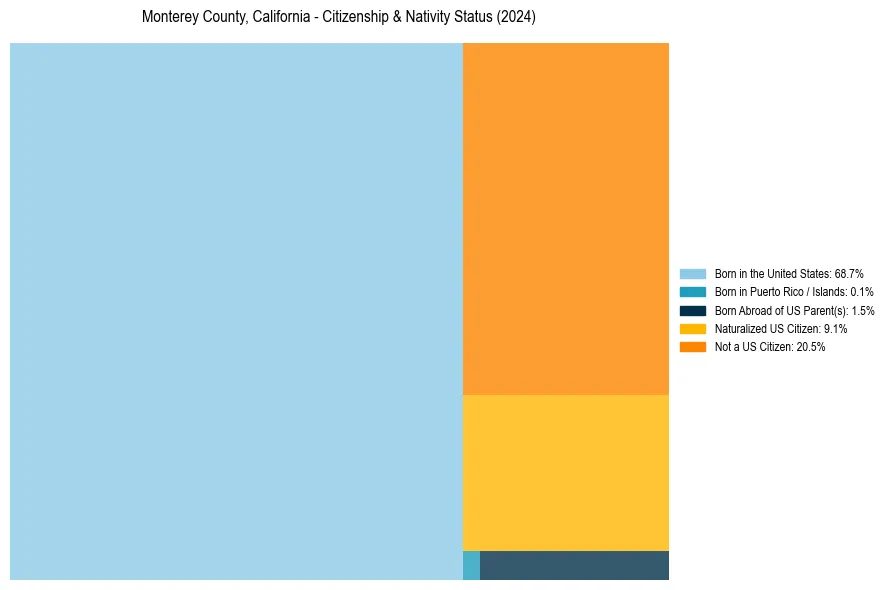
Monterey County, California Nativity & Citizenship Indicators (2024)
Native Born
70.4%
Foreign Born
29.6%
Naturalized
9.1%
US Citizens
79.5%
Monterey County, California Nativity & Citizenship Distribution
Monterey County, California Historical Nativity Trends (2010–2024)
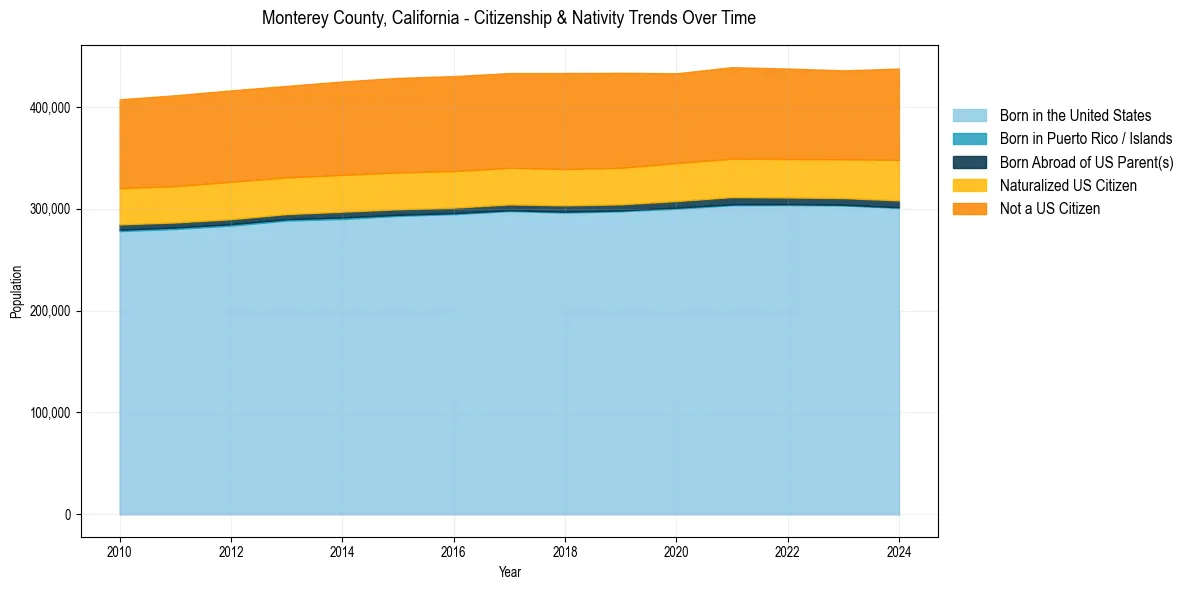
Monterey County, California Population & Nativity History
| Year | Total Pop | Foreign Born | Native Born |
|---|---|---|---|
| 2024 | 437,613 | 29.6% | 70.4% |
| 2023 | 435,834 | 28.8% | 71.2% |
| 2022 | 437,609 | 28.9% | 71.1% |
| 2021 | 438,953 | 29.0% | 71.0% |
| 2020 | 432,977 | 29.0% | 71.0% |
| 2019 | 433,410 | 29.8% | 70.2% |
| 2018 | 433,212 | 30.0% | 70.0% |
| 2017 | 433,168 | 29.8% | 70.2% |
| 2016 | 430,201 | 30.0% | 70.0% |
| 2015 | 428,441 | 30.1% | 69.9% |
| 2014 | 424,927 | 30.1% | 69.9% |
| 2013 | 420,569 | 29.9% | 70.1% |
| 2012 | 416,199 | 30.4% | 69.6% |
| 2011 | 411,385 | 30.3% | 69.7% |
| 2010 | 407,435 | 30.1% | 69.9% |
Nativity & Citizenship FAQs for Monterey County, California
Approximately 29.6% of residents in Monterey County, California were born outside the United States.
The vast majority of residents, roughly 79.5%, are U.S. citizens (including both native-born and naturalized citizens).