Napa County, California Nativity & Citizenship Status (2024)
Place of birth and citizenship status analysis for Napa County, California
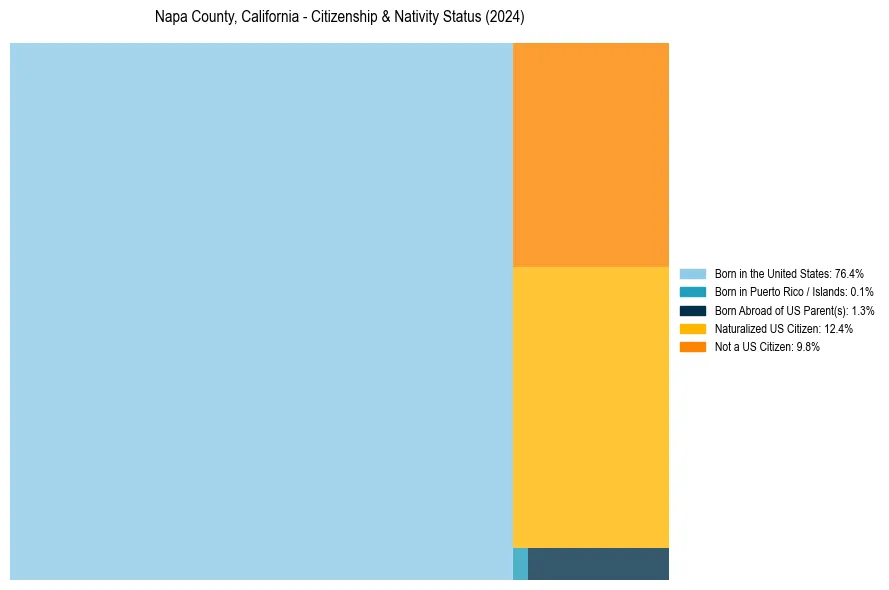
Napa County, California Nativity & Citizenship Indicators (2024)
Native Born
77.8%
Foreign Born
22.2%
Naturalized
12.4%
US Citizens
90.2%
Napa County, California Nativity & Citizenship Distribution
Napa County, California Historical Nativity Trends (2010–2024)
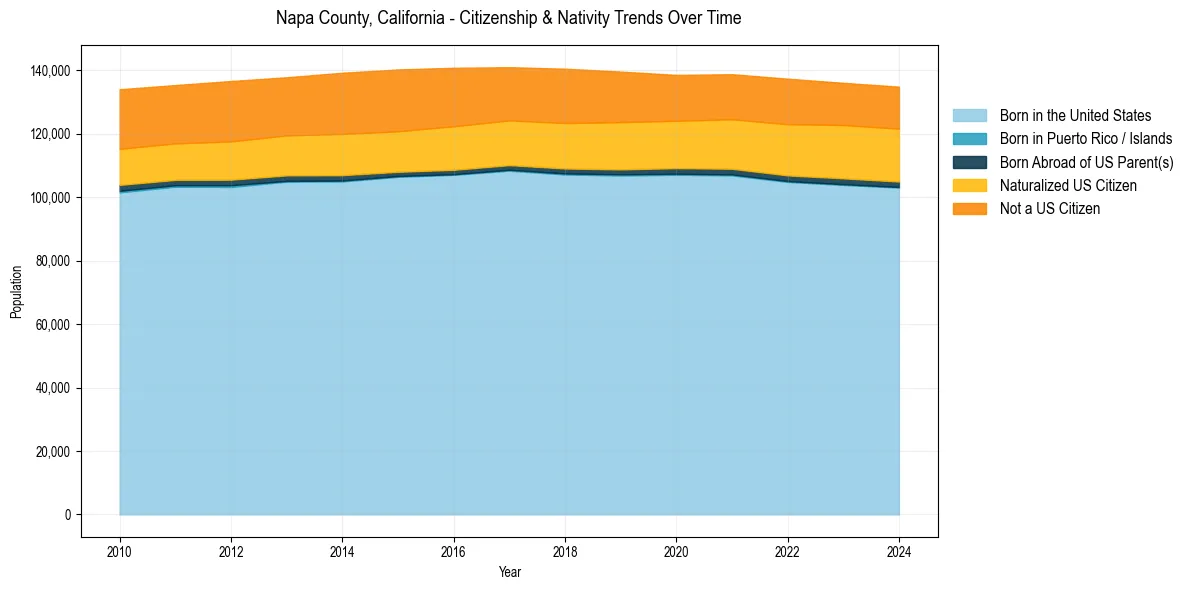
Napa County, California Population & Nativity History
| Year | Total Pop | Foreign Born | Native Born |
|---|---|---|---|
| 2024 | 134,869 | 22.2% | 77.8% |
| 2023 | 136,070 | 22.1% | 77.9% |
| 2022 | 137,384 | 22.2% | 77.8% |
| 2021 | 138,795 | 21.5% | 78.5% |
| 2020 | 138,572 | 21.2% | 78.8% |
| 2019 | 139,623 | 22.1% | 77.9% |
| 2018 | 140,530 | 22.4% | 77.6% |
| 2017 | 141,005 | 21.9% | 78.1% |
| 2016 | 140,823 | 22.8% | 77.2% |
| 2015 | 140,295 | 23.0% | 77.0% |
| 2014 | 139,253 | 23.2% | 76.8% |
| 2013 | 137,837 | 22.4% | 77.6% |
| 2012 | 136,644 | 22.8% | 77.2% |
| 2011 | 135,377 | 22.1% | 77.9% |
| 2010 | 134,051 | 22.5% | 77.5% |
Nativity & Citizenship FAQs for Napa County, California
Approximately 22.2% of residents in Napa County, California were born outside the United States.
The vast majority of residents, roughly 90.2%, are U.S. citizens (including both native-born and naturalized citizens).