California Nativity & Citizenship Status (2024)
Place of birth and citizenship status analysis for California
California Nativity & Citizenship Indicators (2024)
Native Born
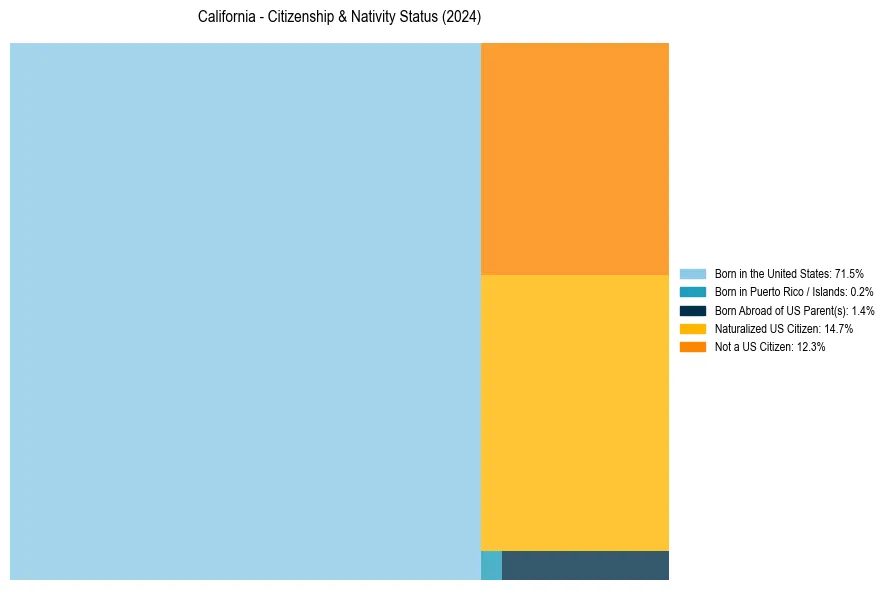
73.0%
Foreign Born
27.0%
Naturalized
14.7%
US Citizens
87.7%
California Nativity & Citizenship Distribution
California Historical Nativity Trends (2010–2024)
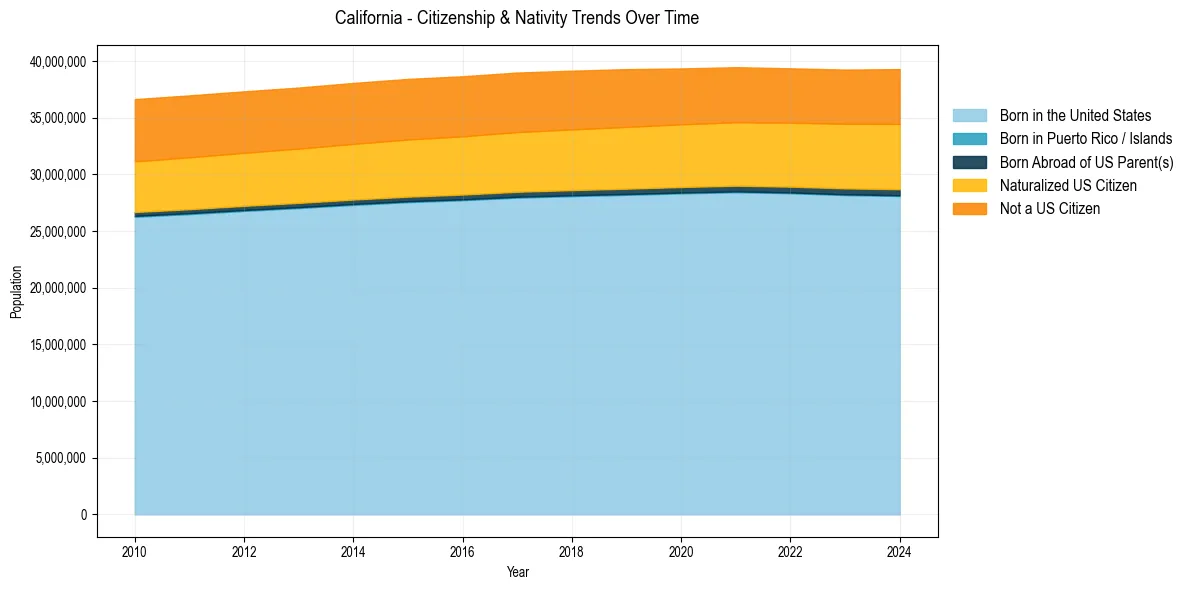
California Population & Nativity History
| Year | Total Pop | Foreign Born | Native Born |
|---|---|---|---|
| 2024 | 39,287,377 | 27.0% | 73.0% |
| 2023 | 39,242,785 | 26.7% | 73.3% |
| 2022 | 39,356,104 | 26.5% | 73.5% |
| 2021 | 39,455,353 | 26.5% | 73.5% |
| 2020 | 39,346,023 | 26.6% | 73.4% |
| 2019 | 39,283,497 | 26.8% | 73.2% |
| 2018 | 39,148,760 | 26.9% | 73.1% |
| 2017 | 38,982,847 | 27.0% | 73.0% |
| 2016 | 38,654,206 | 27.0% | 73.0% |
| 2015 | 38,421,464 | 27.0% | 73.0% |
| 2014 | 38,066,920 | 27.0% | 73.0% |
| 2013 | 37,659,181 | 27.0% | 73.0% |
| 2012 | 37,325,068 | 27.1% | 72.9% |
| 2011 | 36,969,200 | 27.2% | 72.8% |
| 2010 | 36,637,290 | 27.2% | 72.8% |
Nativity & Citizenship FAQs for California
Approximately 27.0% of residents in California were born outside the United States.
The vast majority of residents, roughly 87.7%, are U.S. citizens (including both native-born and naturalized citizens).