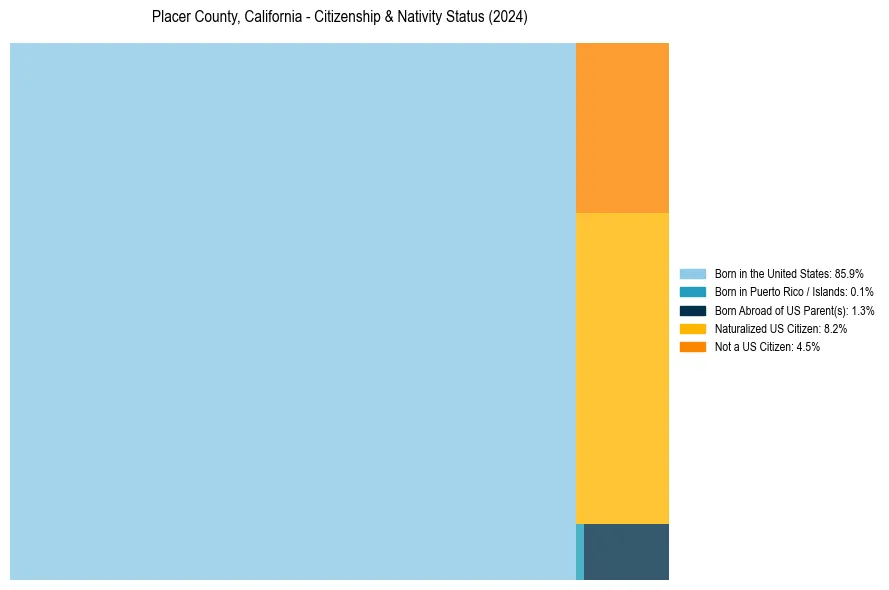
Placer County, California Nativity & Citizenship Status (2024)
Place of birth and citizenship status analysis for Placer County, California
Placer County, California Nativity & Citizenship Indicators (2024)
Native Born
87.3%
Foreign Born
12.7%
Naturalized
8.2%
US Citizens
95.5%
Placer County, California Nativity & Citizenship Distribution
Placer County, California Historical Nativity Trends (2010–2024)
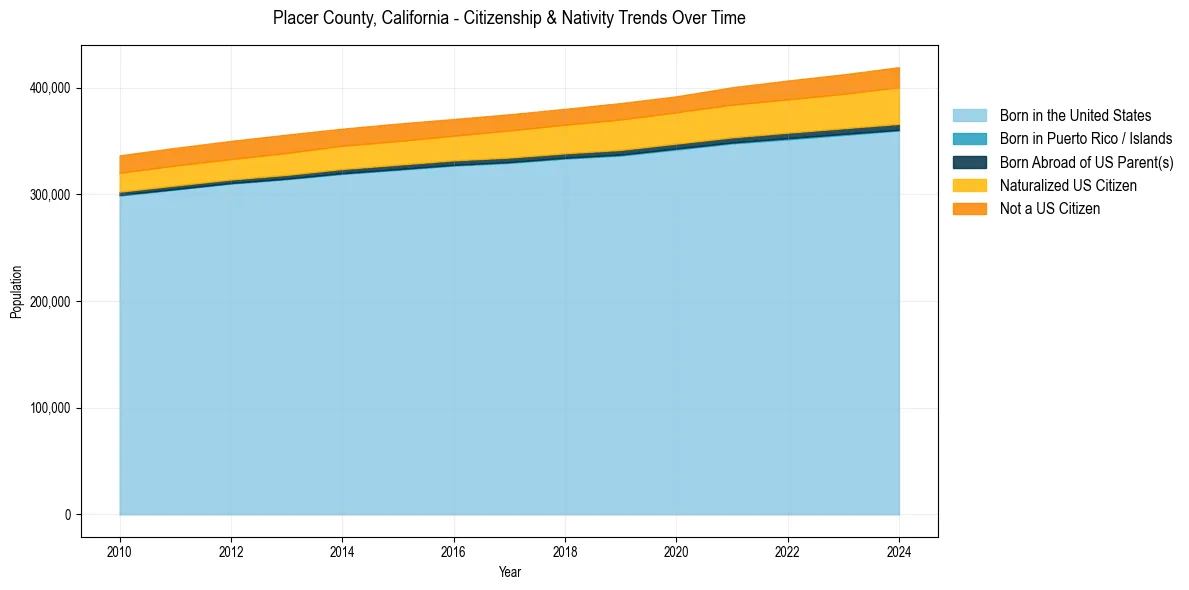
Placer County, California Population & Nativity History
| Year | Total Pop | Foreign Born | Native Born |
|---|---|---|---|
| 2024 | 419,156 | 12.7% | 87.3% |
| 2023 | 412,435 | 12.2% | 87.8% |
| 2022 | 406,608 | 12.0% | 88.0% |
| 2021 | 400,330 | 11.7% | 88.3% |
| 2020 | 391,799 | 11.3% | 88.7% |
| 2019 | 385,512 | 11.4% | 88.6% |
| 2018 | 380,077 | 11.0% | 89.0% |
| 2017 | 374,985 | 10.8% | 89.2% |
| 2016 | 370,571 | 10.5% | 89.5% |
| 2015 | 366,280 | 10.5% | 89.5% |
| 2014 | 361,518 | 10.5% | 89.5% |
| 2013 | 355,924 | 10.6% | 89.4% |
| 2012 | 350,074 | 10.3% | 89.7% |
| 2011 | 343,554 | 10.3% | 89.7% |
| 2010 | 336,477 | 10.1% | 89.9% |
Nativity & Citizenship FAQs for Placer County, California
Approximately 12.7% of residents in Placer County, California were born outside the United States.
The vast majority of residents, roughly 95.5%, are U.S. citizens (including both native-born and naturalized citizens).