California Race & Ethnicity Demographics (2024)
Racial distribution and diversity statistics for California
California Diversity Indicators (2024)
Total Population
39,287,377
Diversity Score
69.7
Diversity Tier
High
Largest Group
Hispanic or Latino
40.2%%
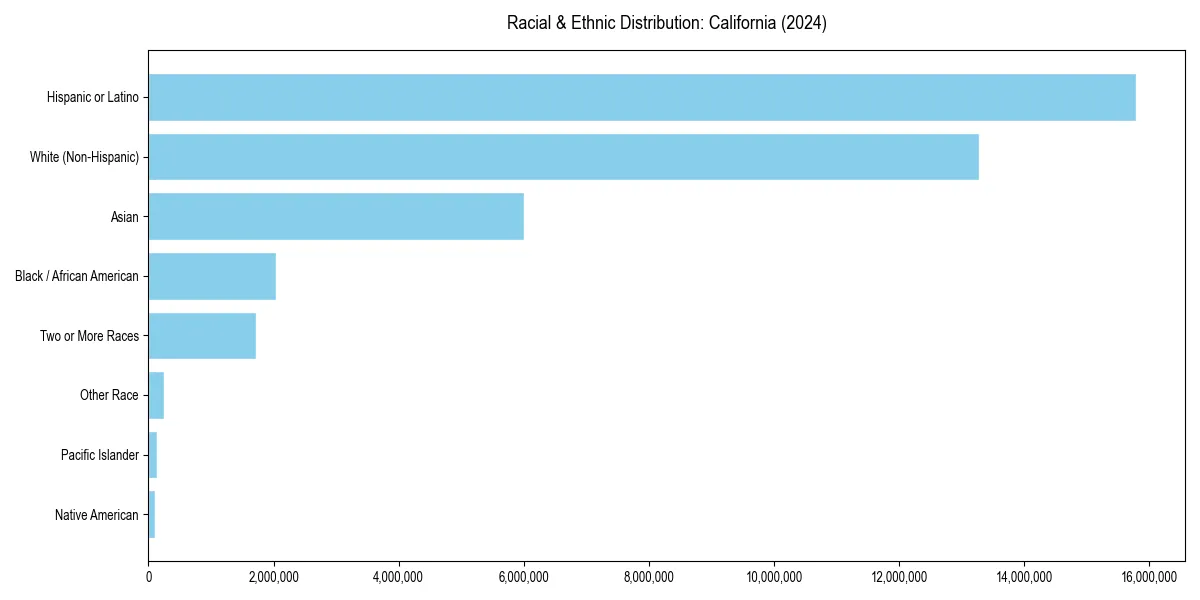
California Racial & Ethnic Breakdown
California Historical Diversity Trend (2010–2024)
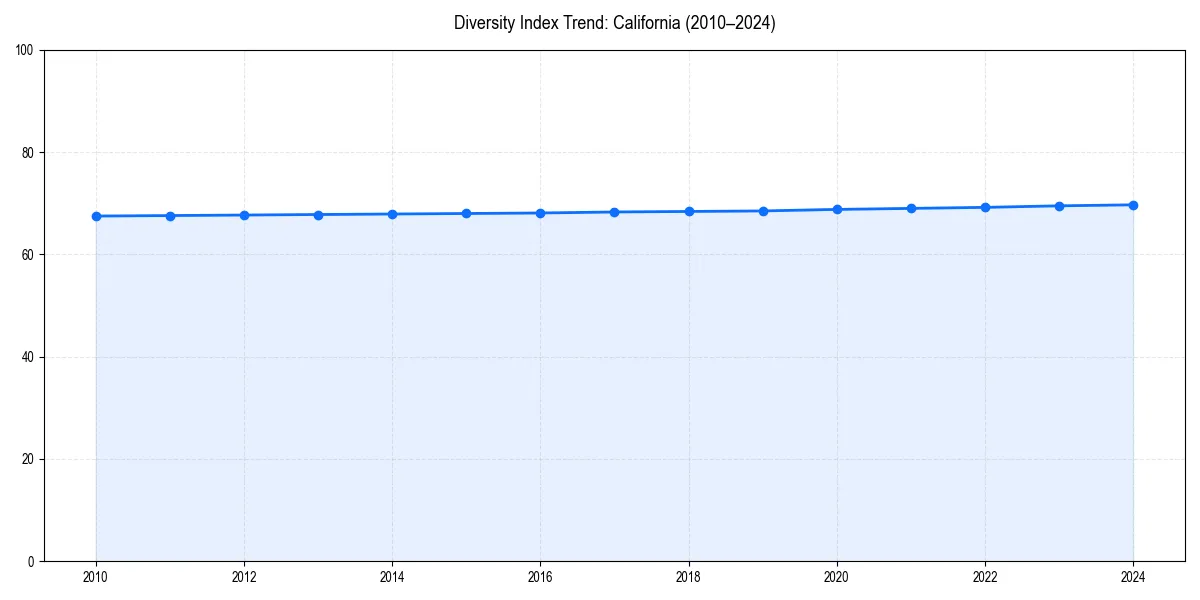
Since 2010, the diversity index of California has increased slightly.
California Population by Race & Ethnicity
| Race / Ethnicity | Population | Percentage |
|---|---|---|
| Hispanic or Latino | 15,778,963 | 40.2% |
| White (Non-Hispanic) | 13,267,442 | 33.8% |
| Asian | 6,007,197 | 15.3% |
| Black / African American | 2,040,095 | 5.2% |
| Two or More Races | 1,718,181 | 4.4% |
| Other Race | 241,084 | 0.6% |
| Pacific Islander | 131,885 | 0.3% |
| Native American | 102,530 | 0.3% |
Diversity & Demographics FAQs for California
The largest racial or ethnic group in California is Hispanic or Latino, which makes up 40.2% of the total population.
Since 2010, the diversity index for California has increased slightly. The area currently has a diversity score of 69.7/100, which is considered a High level of diversity.