Riverside County, California Nativity & Citizenship Status (2024)
Place of birth and citizenship status analysis for Riverside County, California
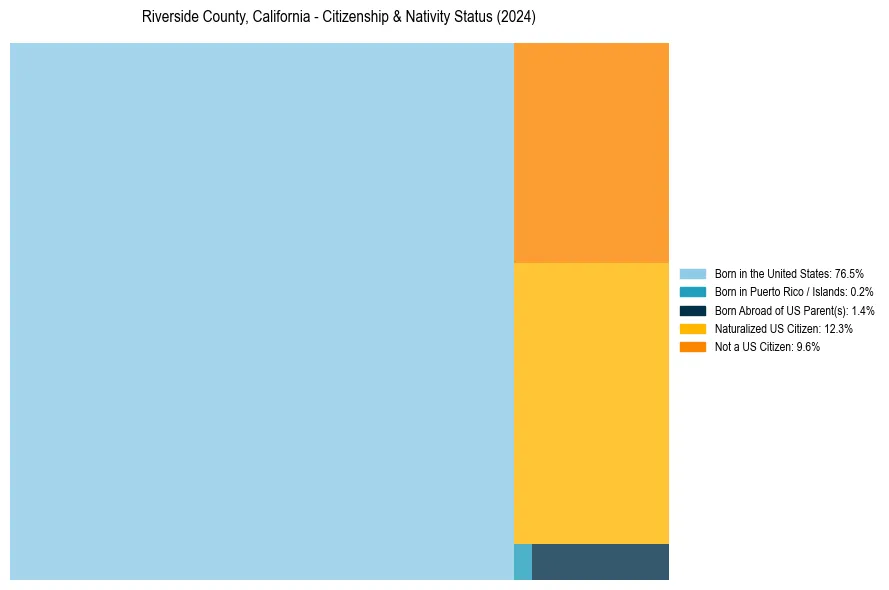
Riverside County, California Nativity & Citizenship Indicators (2024)
Native Born
78.1%
Foreign Born
21.9%
Naturalized
12.3%
US Citizens
90.4%
Riverside County, California Nativity & Citizenship Distribution
Riverside County, California Historical Nativity Trends (2010–2024)
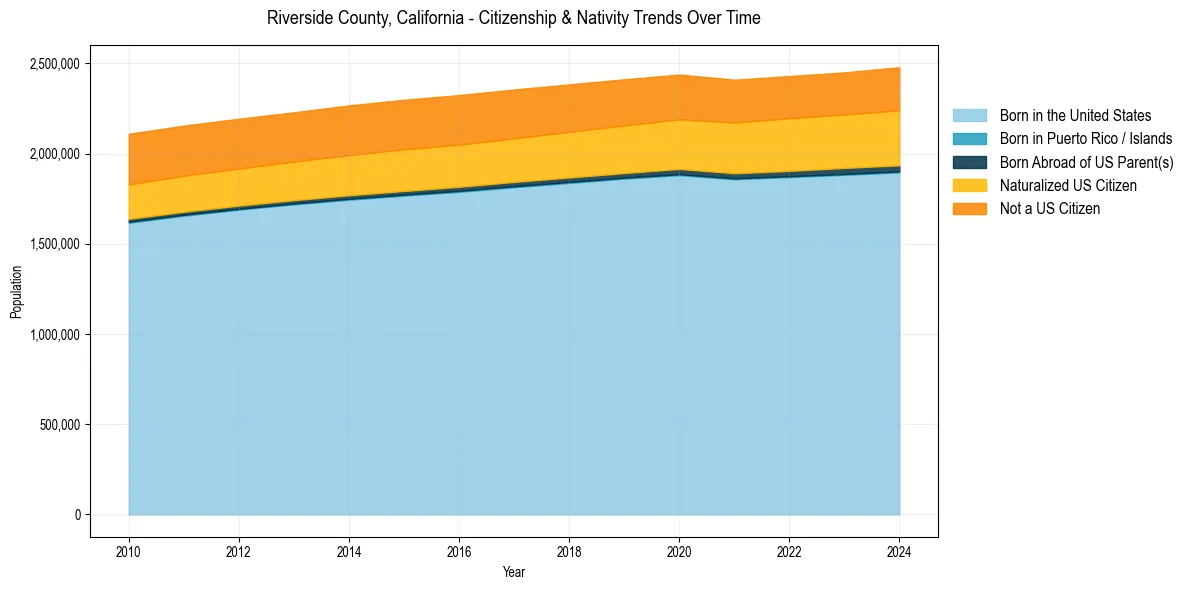
Riverside County, California Population & Nativity History
| Year | Total Pop | Foreign Born | Native Born |
|---|---|---|---|
| 2024 | 2,478,600 | 21.9% | 78.1% |
| 2023 | 2,449,909 | 21.6% | 78.4% |
| 2022 | 2,429,487 | 21.6% | 78.4% |
| 2021 | 2,409,331 | 21.5% | 78.5% |
| 2020 | 2,437,864 | 21.5% | 78.5% |
| 2019 | 2,411,439 | 21.6% | 78.4% |
| 2018 | 2,383,286 | 21.7% | 78.3% |
| 2017 | 2,355,002 | 21.8% | 78.2% |
| 2016 | 2,323,892 | 21.9% | 78.1% |
| 2015 | 2,298,032 | 22.0% | 78.0% |
| 2014 | 2,266,899 | 22.0% | 78.0% |
| 2013 | 2,228,528 | 21.9% | 78.1% |
| 2012 | 2,192,982 | 22.0% | 78.0% |
| 2011 | 2,154,844 | 22.2% | 77.8% |
| 2010 | 2,109,464 | 22.4% | 77.6% |
Nativity & Citizenship FAQs for Riverside County, California
Approximately 21.9% of residents in Riverside County, California were born outside the United States.
The vast majority of residents, roughly 90.4%, are U.S. citizens (including both native-born and naturalized citizens).