San Benito County, California Nativity & Citizenship Status (2024)
Place of birth and citizenship status analysis for San Benito County, California
San Benito County, California Nativity & Citizenship Indicators (2024)
Native Born
80.0%
Foreign Born
20.0%
Naturalized
9.0%
US Citizens
89.0%
San Benito County, California Nativity & Citizenship Distribution

San Benito County, California Historical Nativity Trends (2010–2024)
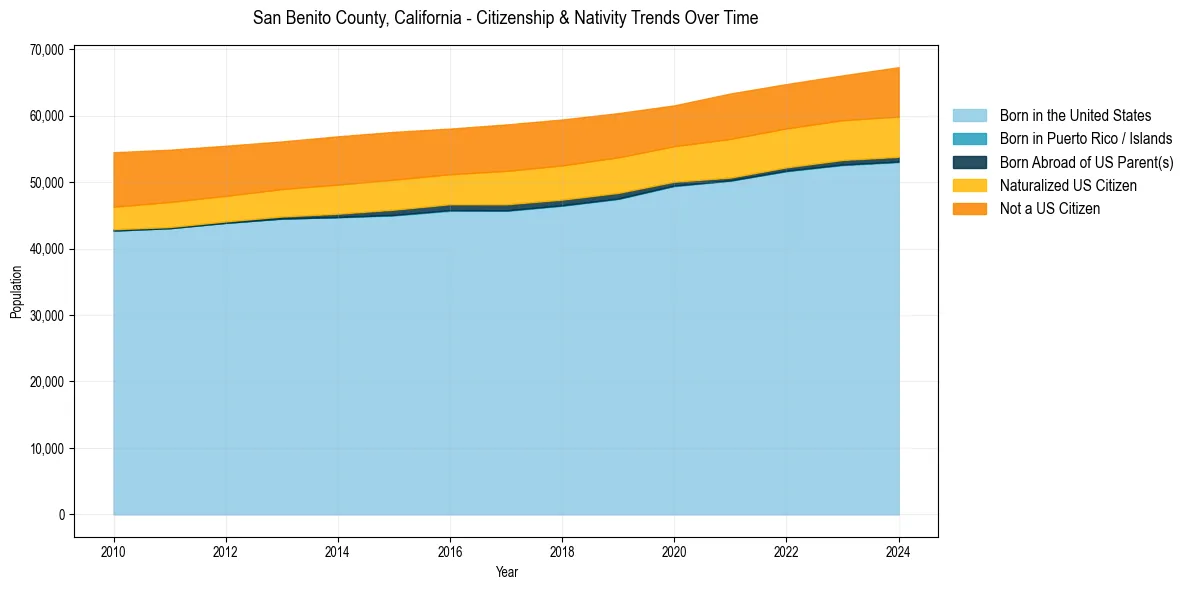
San Benito County, California Population & Nativity History
| Year | Total Pop | Foreign Born | Native Born |
|---|---|---|---|
| 2024 | 67,290 | 20.0% | 80.0% |
| 2023 | 66,056 | 19.3% | 80.7% |
| 2022 | 64,753 | 19.4% | 80.6% |
| 2021 | 63,329 | 20.0% | 80.0% |
| 2020 | 61,547 | 18.7% | 81.3% |
| 2019 | 60,376 | 19.9% | 80.1% |
| 2018 | 59,416 | 20.3% | 79.7% |
| 2017 | 58,671 | 20.5% | 79.5% |
| 2016 | 58,051 | 19.6% | 80.4% |
| 2015 | 57,557 | 20.3% | 79.7% |
| 2014 | 56,888 | 20.5% | 79.5% |
| 2013 | 56,115 | 20.1% | 79.9% |
| 2012 | 55,467 | 20.5% | 79.5% |
| 2011 | 54,873 | 21.2% | 78.8% |
| 2010 | 54,492 | 21.3% | 78.7% |
Nativity & Citizenship FAQs for San Benito County, California
Approximately 20.0% of residents in San Benito County, California were born outside the United States.
The vast majority of residents, roughly 89.0%, are U.S. citizens (including both native-born and naturalized citizens).