San Diego County, California Nativity & Citizenship Status (2024)
Place of birth and citizenship status analysis for San Diego County, California
San Diego County, California Nativity & Citizenship Indicators (2024)
Native Born
77.2%
Foreign Born
22.8%
Naturalized
13.5%
US Citizens
90.7%
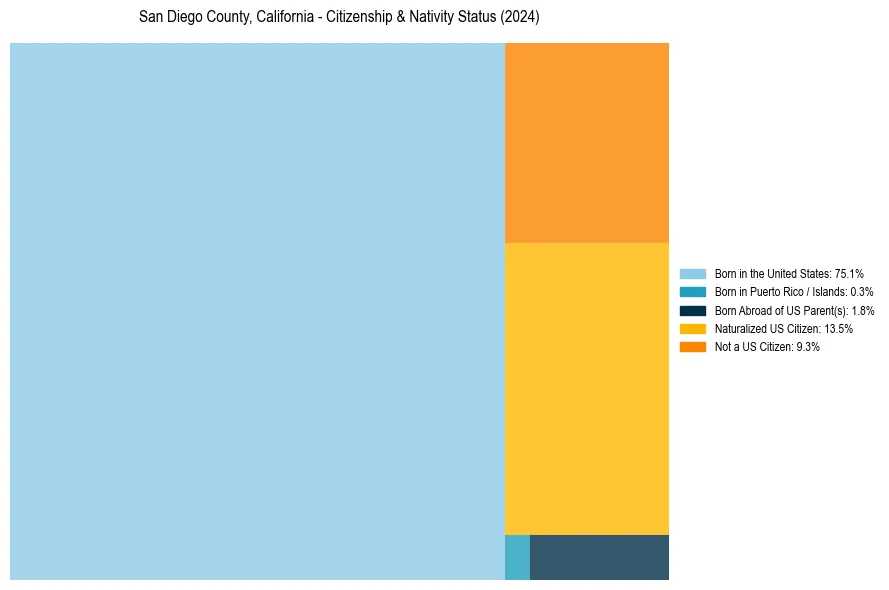
San Diego County, California Nativity & Citizenship Distribution
San Diego County, California Historical Nativity Trends (2010–2024)
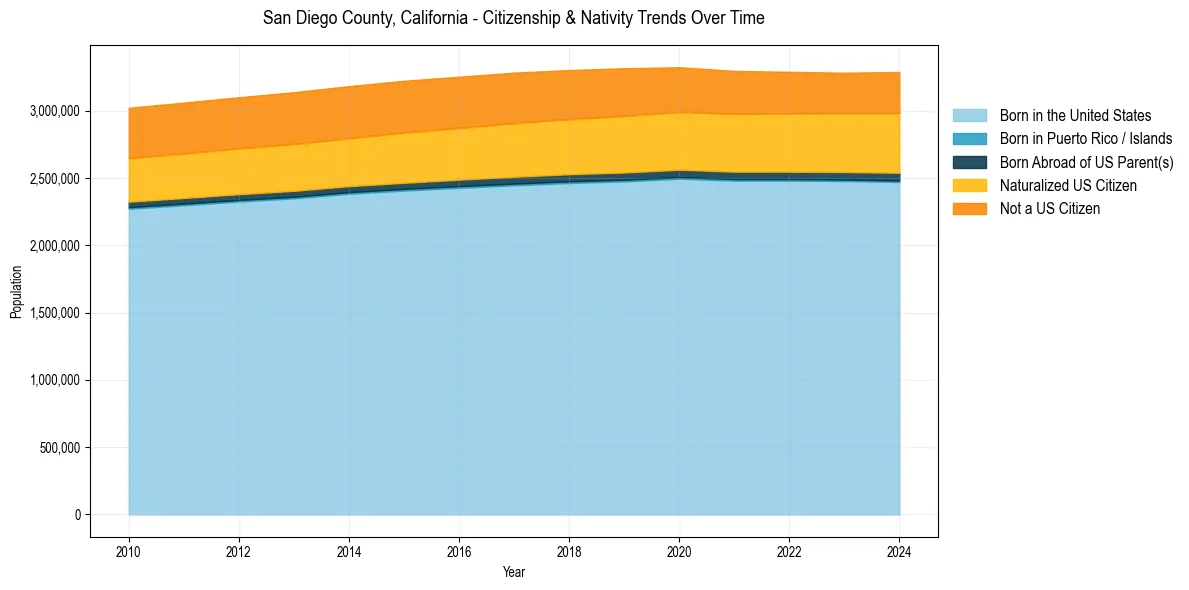
San Diego County, California Population & Nativity History
| Year | Total Pop | Foreign Born | Native Born |
|---|---|---|---|
| 2024 | 3,288,774 | 22.8% | 77.2% |
| 2023 | 3,282,782 | 22.5% | 77.5% |
| 2022 | 3,289,701 | 22.6% | 77.4% |
| 2021 | 3,296,317 | 22.7% | 77.3% |
| 2020 | 3,323,970 | 22.9% | 77.1% |
| 2019 | 3,316,073 | 23.4% | 76.6% |
| 2018 | 3,302,833 | 23.4% | 76.6% |
| 2017 | 3,283,665 | 23.6% | 76.4% |
| 2016 | 3,253,356 | 23.5% | 76.5% |
| 2015 | 3,223,096 | 23.5% | 76.5% |
| 2014 | 3,183,143 | 23.4% | 76.6% |
| 2013 | 3,138,265 | 23.4% | 76.6% |
| 2012 | 3,100,500 | 23.2% | 76.8% |
| 2011 | 3,060,849 | 23.2% | 76.8% |
| 2010 | 3,022,468 | 23.1% | 76.9% |
Nativity & Citizenship FAQs for San Diego County, California
Approximately 22.8% of residents in San Diego County, California were born outside the United States.
The vast majority of residents, roughly 90.7%, are U.S. citizens (including both native-born and naturalized citizens).