San Francisco County, California Nativity & Citizenship Status (2024)
Place of birth and citizenship status analysis for San Francisco County, California
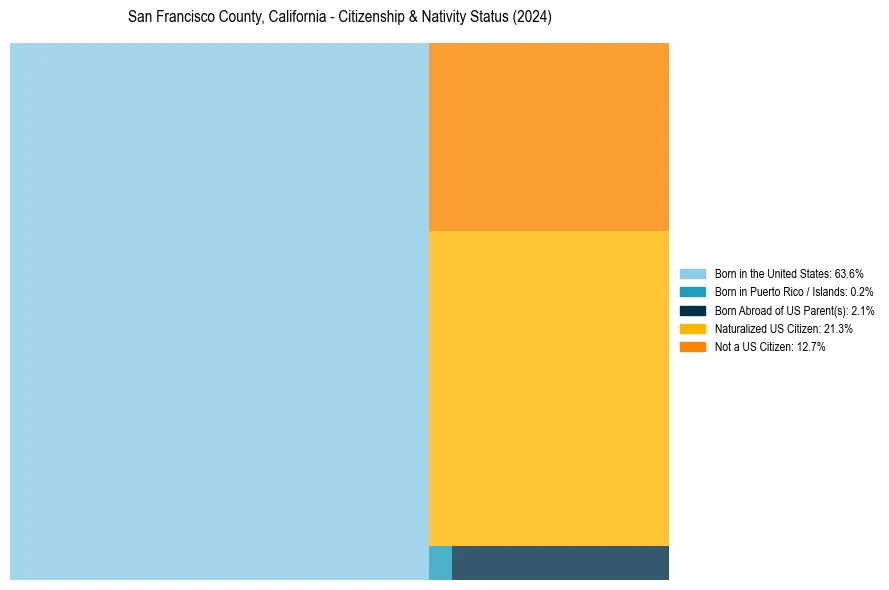
San Francisco County, California Nativity & Citizenship Indicators (2024)
Native Born
66.0%
Foreign Born
34.0%
Naturalized
21.3%
US Citizens
87.3%
San Francisco County, California Nativity & Citizenship Distribution
San Francisco County, California Historical Nativity Trends (2010–2024)
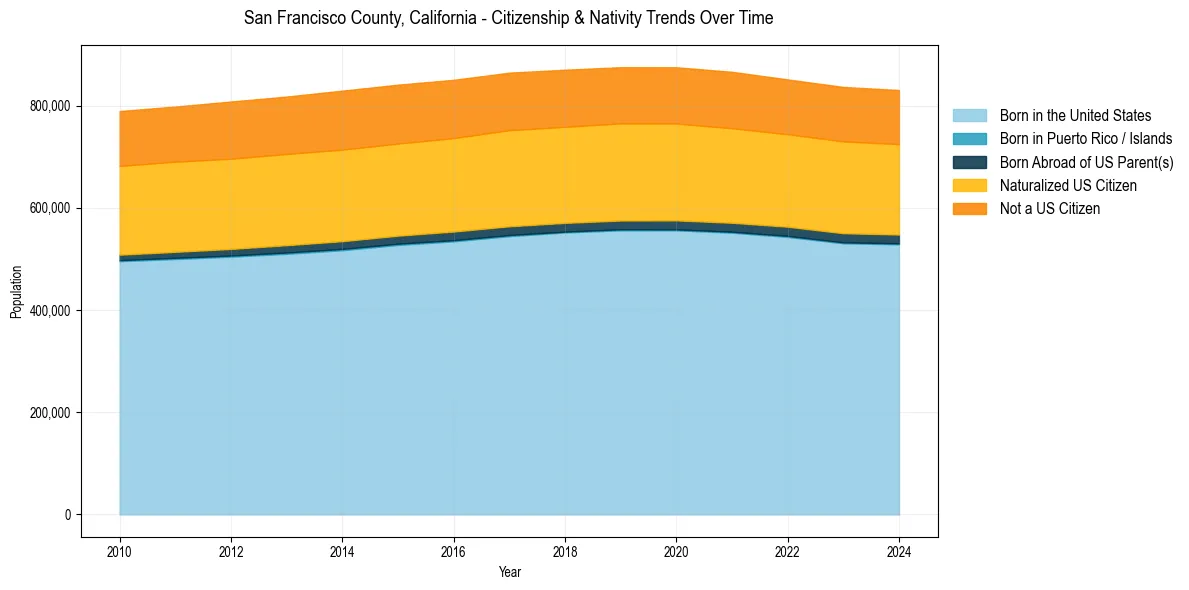
San Francisco County, California Population & Nativity History
| Year | Total Pop | Foreign Born | Native Born |
|---|---|---|---|
| 2024 | 830,235 | 34.0% | 66.0% |
| 2023 | 836,321 | 34.2% | 65.8% |
| 2022 | 851,036 | 33.9% | 66.1% |
| 2021 | 865,933 | 34.1% | 65.9% |
| 2020 | 874,784 | 34.2% | 65.8% |
| 2019 | 874,961 | 34.3% | 65.7% |
| 2018 | 870,044 | 34.4% | 65.6% |
| 2017 | 864,263 | 34.8% | 65.2% |
| 2016 | 850,282 | 34.9% | 65.1% |
| 2015 | 840,763 | 35.1% | 64.9% |
| 2014 | 829,072 | 35.5% | 64.5% |
| 2013 | 817,501 | 35.6% | 64.4% |
| 2012 | 807,755 | 35.7% | 64.3% |
| 2011 | 797,983 | 35.6% | 64.4% |
| 2010 | 789,172 | 35.6% | 64.4% |
Nativity & Citizenship FAQs for San Francisco County, California
Approximately 34.0% of residents in San Francisco County, California were born outside the United States.
The vast majority of residents, roughly 87.3%, are U.S. citizens (including both native-born and naturalized citizens).