San Joaquin County, California Nativity & Citizenship Status (2024)
Place of birth and citizenship status analysis for San Joaquin County, California
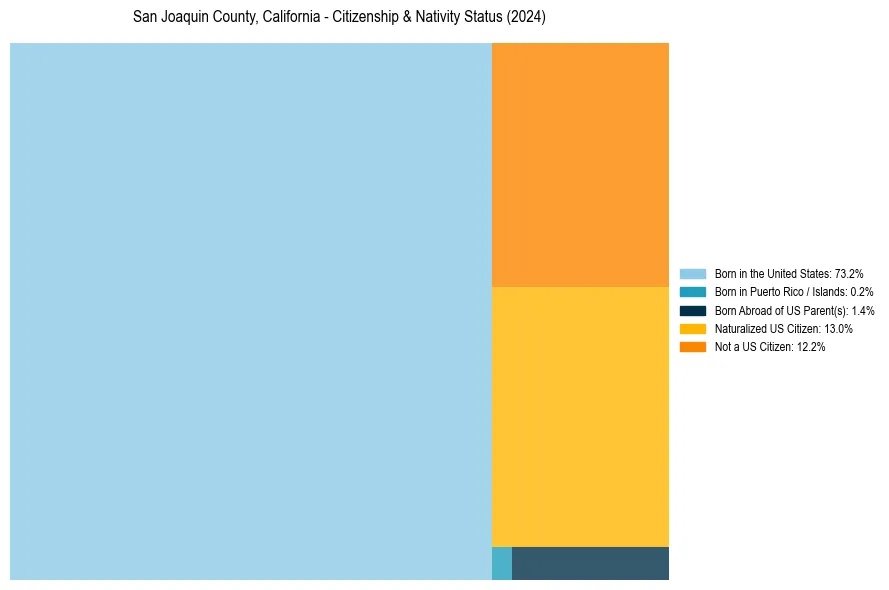
San Joaquin County, California Nativity & Citizenship Indicators (2024)
Native Born
74.8%
Foreign Born
25.2%
Naturalized
13.0%
US Citizens
87.8%
San Joaquin County, California Nativity & Citizenship Distribution
San Joaquin County, California Historical Nativity Trends (2010–2024)
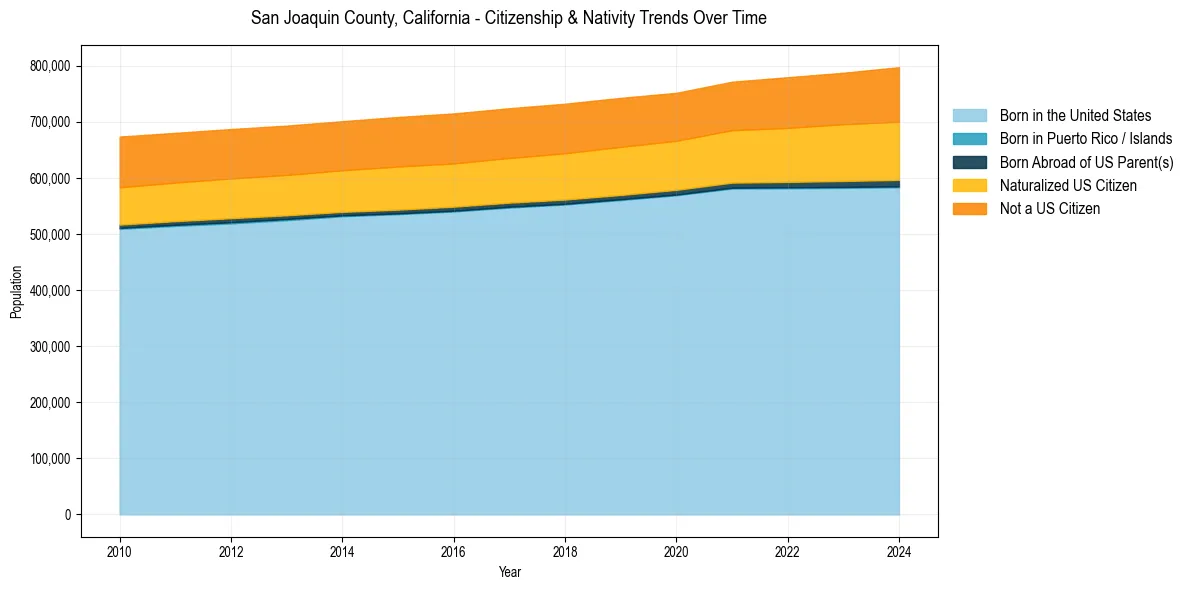
San Joaquin County, California Population & Nativity History
| Year | Total Pop | Foreign Born | Native Born |
|---|---|---|---|
| 2024 | 797,334 | 25.2% | 74.8% |
| 2023 | 787,416 | 24.5% | 75.5% |
| 2022 | 779,445 | 23.9% | 76.1% |
| 2021 | 771,406 | 23.3% | 76.7% |
| 2020 | 751,615 | 23.0% | 77.0% |
| 2019 | 742,603 | 23.3% | 76.7% |
| 2018 | 732,212 | 23.3% | 76.7% |
| 2017 | 724,153 | 23.3% | 76.7% |
| 2016 | 714,860 | 23.3% | 76.7% |
| 2015 | 708,554 | 23.3% | 76.7% |
| 2014 | 701,050 | 23.1% | 76.9% |
| 2013 | 693,177 | 23.1% | 76.9% |
| 2012 | 687,036 | 23.1% | 76.9% |
| 2011 | 680,277 | 23.1% | 76.9% |
| 2010 | 673,613 | 23.3% | 76.7% |
Nativity & Citizenship FAQs for San Joaquin County, California
Approximately 25.2% of residents in San Joaquin County, California were born outside the United States.
The vast majority of residents, roughly 87.8%, are U.S. citizens (including both native-born and naturalized citizens).