San Luis Obispo County, California Nativity & Citizenship Status (2024)
Place of birth and citizenship status analysis for San Luis Obispo County, California
San Luis Obispo County, California Nativity & Citizenship Indicators (2024)
Native Born
90.1%
Foreign Born
9.9%
Naturalized
5.1%
US Citizens
95.2%
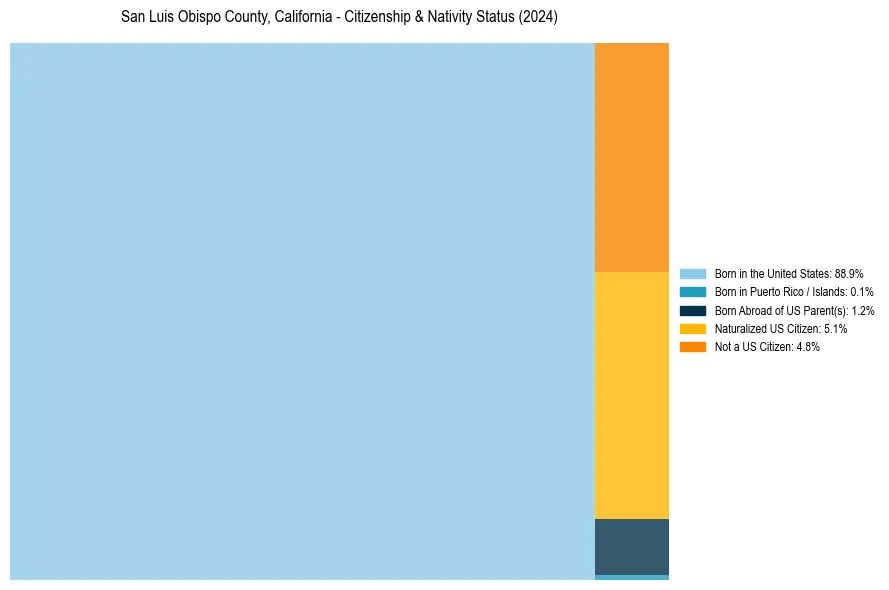
San Luis Obispo County, California Nativity & Citizenship Distribution
San Luis Obispo County, California Historical Nativity Trends (2010–2024)
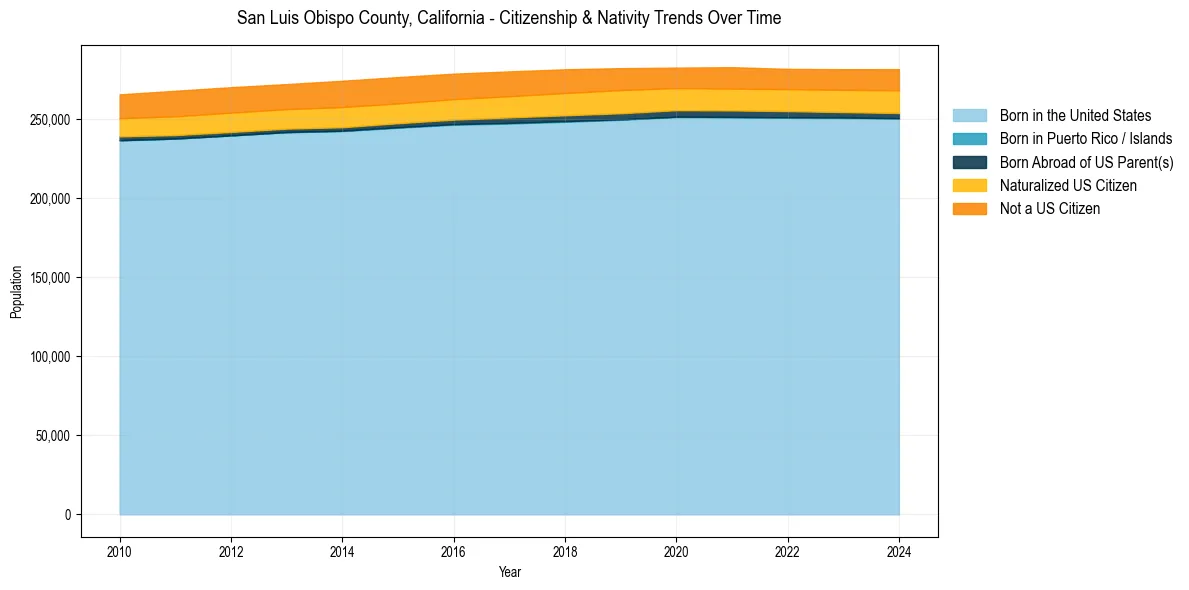
San Luis Obispo County, California Population & Nativity History
| Year | Total Pop | Foreign Born | Native Born |
|---|---|---|---|
| 2024 | 281,555 | 9.9% | 90.1% |
| 2023 | 281,486 | 9.6% | 90.4% |
| 2022 | 281,712 | 9.5% | 90.5% |
| 2021 | 282,771 | 9.7% | 90.3% |
| 2020 | 282,517 | 9.5% | 90.5% |
| 2019 | 282,165 | 10.1% | 89.9% |
| 2018 | 281,455 | 10.3% | 89.7% |
| 2017 | 280,119 | 10.4% | 89.6% |
| 2016 | 278,680 | 10.4% | 89.6% |
| 2015 | 276,517 | 10.5% | 89.5% |
| 2014 | 274,184 | 10.7% | 89.3% |
| 2013 | 272,094 | 10.4% | 89.6% |
| 2012 | 270,121 | 10.5% | 89.5% |
| 2011 | 267,871 | 10.5% | 89.5% |
| 2010 | 265,577 | 10.0% | 90.0% |
Nativity & Citizenship FAQs for San Luis Obispo County, California
Approximately 9.9% of residents in San Luis Obispo County, California were born outside the United States.
The vast majority of residents, roughly 95.2%, are U.S. citizens (including both native-born and naturalized citizens).