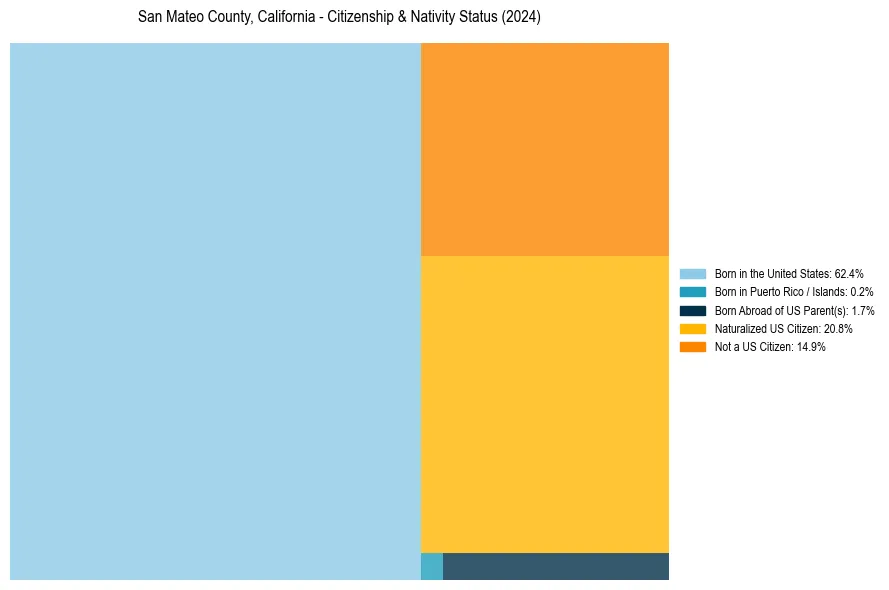
San Mateo County, California Nativity & Citizenship Status (2024)
Place of birth and citizenship status analysis for San Mateo County, California
San Mateo County, California Nativity & Citizenship Indicators (2024)
Native Born
64.3%
Foreign Born
35.7%
Naturalized
20.8%
US Citizens
85.1%
San Mateo County, California Nativity & Citizenship Distribution
San Mateo County, California Historical Nativity Trends (2010–2024)
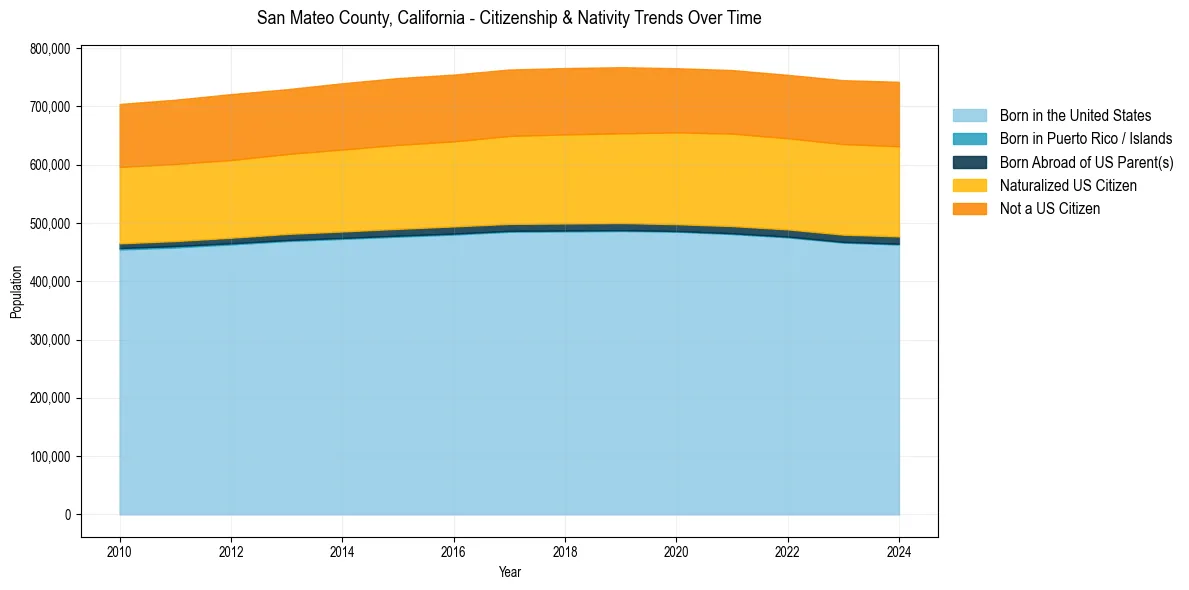
San Mateo County, California Population & Nativity History
| Year | Total Pop | Foreign Born | Native Born |
|---|---|---|---|
| 2024 | 742,340 | 35.7% | 64.3% |
| 2023 | 745,100 | 35.6% | 64.4% |
| 2022 | 754,250 | 35.2% | 64.8% |
| 2021 | 762,488 | 35.1% | 64.9% |
| 2020 | 765,623 | 35.0% | 65.0% |
| 2019 | 767,423 | 34.8% | 65.2% |
| 2018 | 765,935 | 34.8% | 65.2% |
| 2017 | 763,450 | 34.7% | 65.3% |
| 2016 | 754,748 | 34.5% | 65.5% |
| 2015 | 748,731 | 34.6% | 65.4% |
| 2014 | 739,837 | 34.4% | 65.6% |
| 2013 | 729,543 | 34.0% | 66.0% |
| 2012 | 721,183 | 34.2% | 65.8% |
| 2011 | 711,622 | 34.1% | 65.9% |
| 2010 | 704,327 | 34.0% | 66.0% |
Nativity & Citizenship FAQs for San Mateo County, California
Approximately 35.7% of residents in San Mateo County, California were born outside the United States.
The vast majority of residents, roughly 85.1%, are U.S. citizens (including both native-born and naturalized citizens).