Santa Barbara County, California Nativity & Citizenship Status (2024)
Place of birth and citizenship status analysis for Santa Barbara County, California
Santa Barbara County, California Nativity & Citizenship Indicators (2024)
Native Born
77.8%
Foreign Born
22.2%
Naturalized
8.9%
US Citizens
86.7%
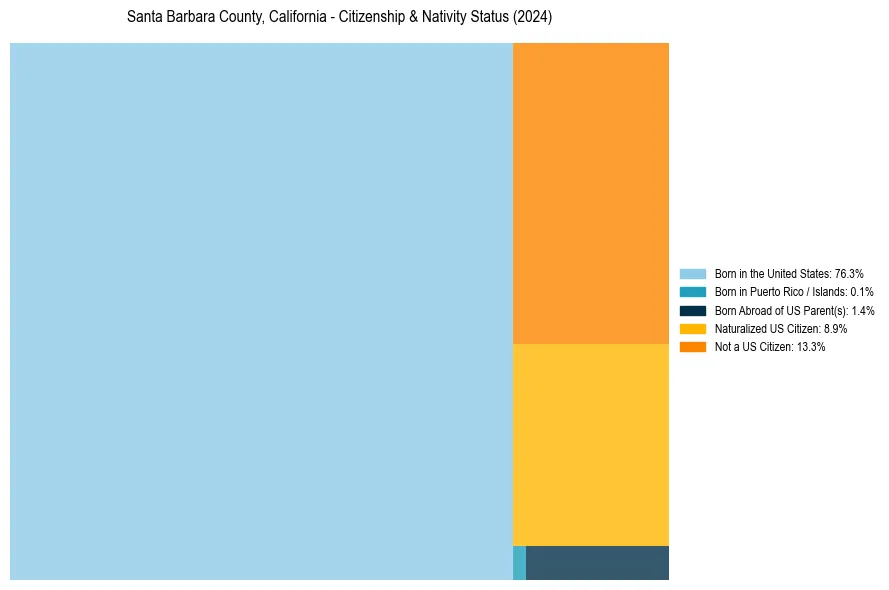
Santa Barbara County, California Nativity & Citizenship Distribution
Santa Barbara County, California Historical Nativity Trends (2010–2024)
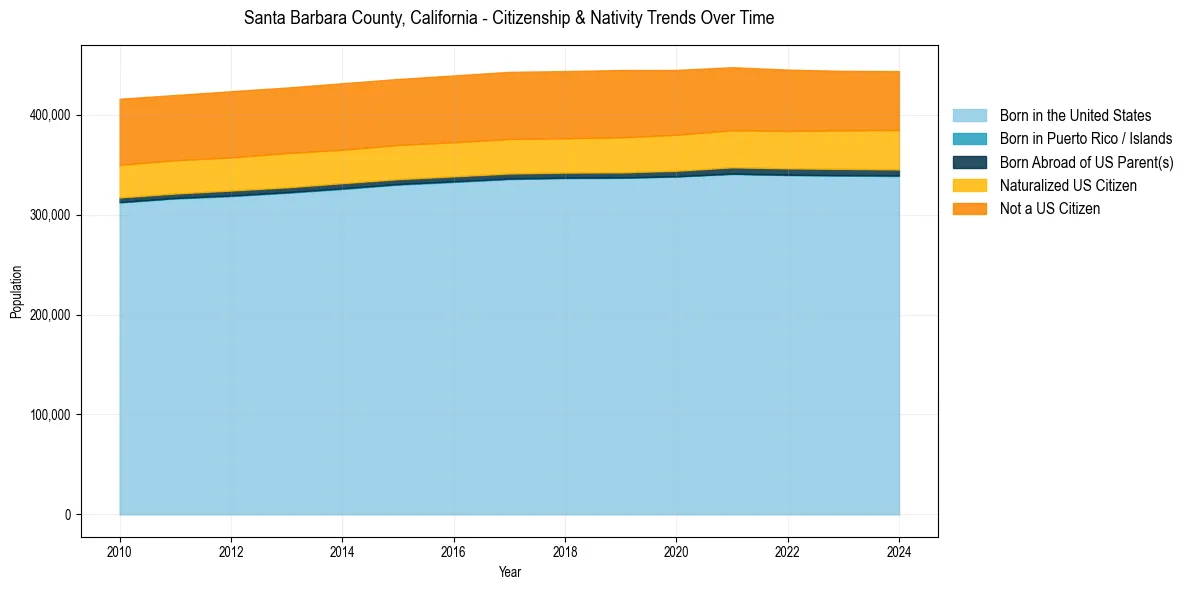
Santa Barbara County, California Population & Nativity History
| Year | Total Pop | Foreign Born | Native Born |
|---|---|---|---|
| 2024 | 443,701 | 22.2% | 77.8% |
| 2023 | 443,975 | 22.1% | 77.9% |
| 2022 | 445,213 | 22.2% | 77.8% |
| 2021 | 447,651 | 22.4% | 77.6% |
| 2020 | 444,895 | 22.7% | 77.3% |
| 2019 | 444,829 | 23.0% | 77.0% |
| 2018 | 443,738 | 22.9% | 77.1% |
| 2017 | 442,996 | 23.0% | 77.0% |
| 2016 | 439,395 | 23.0% | 77.0% |
| 2015 | 435,850 | 23.0% | 77.0% |
| 2014 | 431,555 | 23.2% | 76.8% |
| 2013 | 427,288 | 23.4% | 76.6% |
| 2012 | 423,594 | 23.5% | 76.5% |
| 2011 | 419,793 | 23.5% | 76.5% |
| 2010 | 416,051 | 23.7% | 76.3% |
Nativity & Citizenship FAQs for Santa Barbara County, California
Approximately 22.2% of residents in Santa Barbara County, California were born outside the United States.
The vast majority of residents, roughly 86.7%, are U.S. citizens (including both native-born and naturalized citizens).