Shasta County, California Nativity & Citizenship Status (2024)
Place of birth and citizenship status analysis for Shasta County, California
Shasta County, California Nativity & Citizenship Indicators (2024)
Native Born
95.0%
Foreign Born
5.0%
Naturalized
2.7%
US Citizens
97.6%
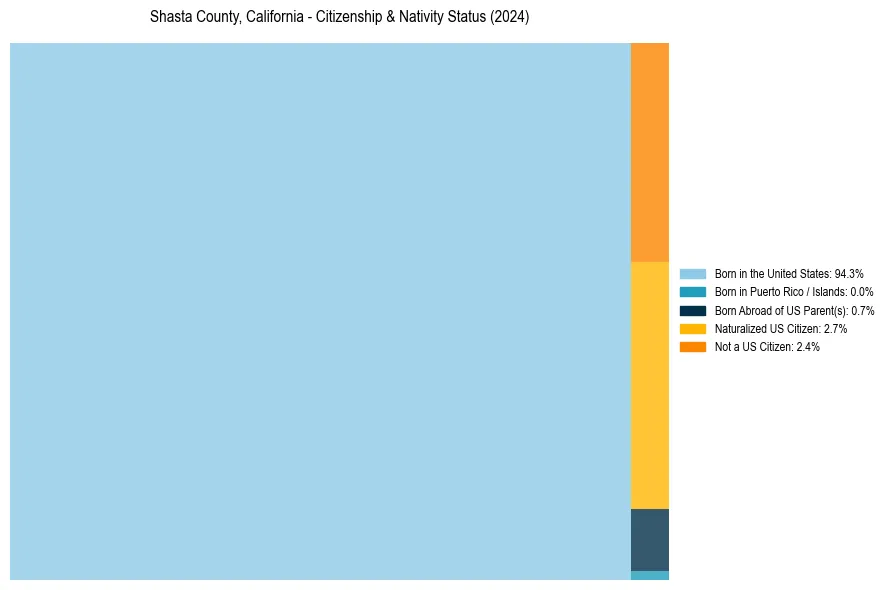
Shasta County, California Nativity & Citizenship Distribution
Shasta County, California Historical Nativity Trends (2010–2024)
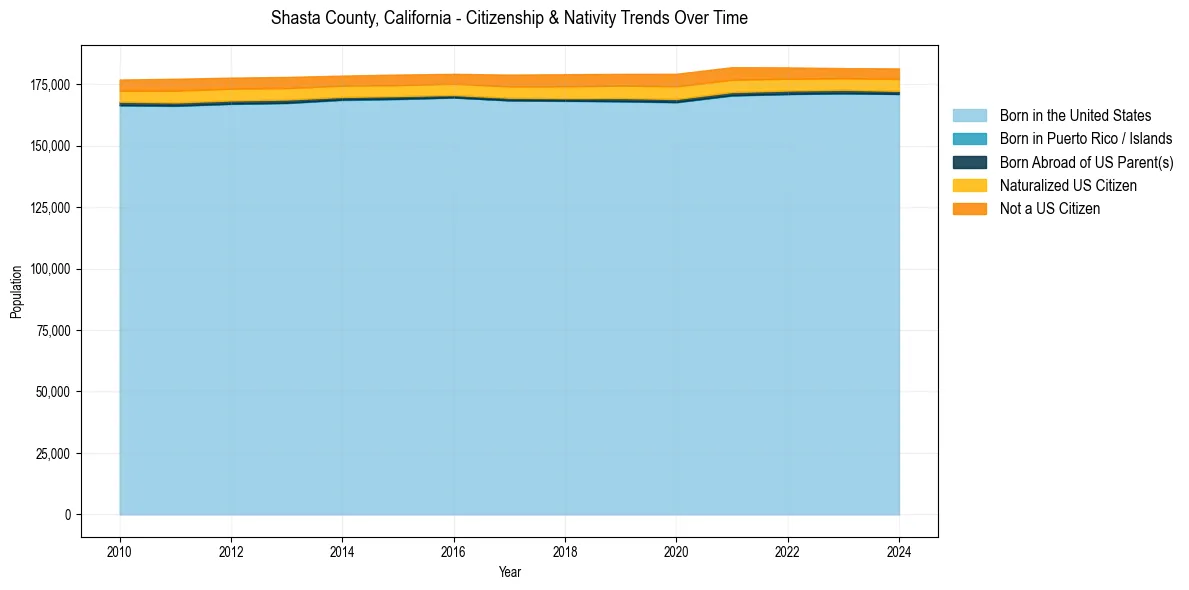
Shasta County, California Population & Nativity History
| Year | Total Pop | Foreign Born | Native Born |
|---|---|---|---|
| 2024 | 181,436 | 5.0% | 95.0% |
| 2023 | 181,554 | 4.9% | 95.1% |
| 2022 | 181,852 | 5.2% | 94.8% |
| 2021 | 181,935 | 5.6% | 94.4% |
| 2020 | 179,267 | 5.7% | 94.3% |
| 2019 | 179,212 | 5.5% | 94.5% |
| 2018 | 179,085 | 5.5% | 94.5% |
| 2017 | 178,919 | 5.3% | 94.7% |
| 2016 | 179,228 | 4.8% | 95.2% |
| 2015 | 178,942 | 4.9% | 95.1% |
| 2014 | 178,520 | 4.9% | 95.1% |
| 2013 | 177,966 | 5.2% | 94.8% |
| 2012 | 177,693 | 5.2% | 94.8% |
| 2011 | 177,231 | 5.4% | 94.6% |
| 2010 | 176,906 | 5.1% | 94.9% |
Nativity & Citizenship FAQs for Shasta County, California
Approximately 5.0% of residents in Shasta County, California were born outside the United States.
The vast majority of residents, roughly 97.6%, are U.S. citizens (including both native-born and naturalized citizens).