Solano County, California Nativity & Citizenship Status (2024)
Place of birth and citizenship status analysis for Solano County, California
Solano County, California Nativity & Citizenship Indicators (2024)
Native Born
79.2%
Foreign Born
20.8%
Naturalized
12.3%
US Citizens
91.5%
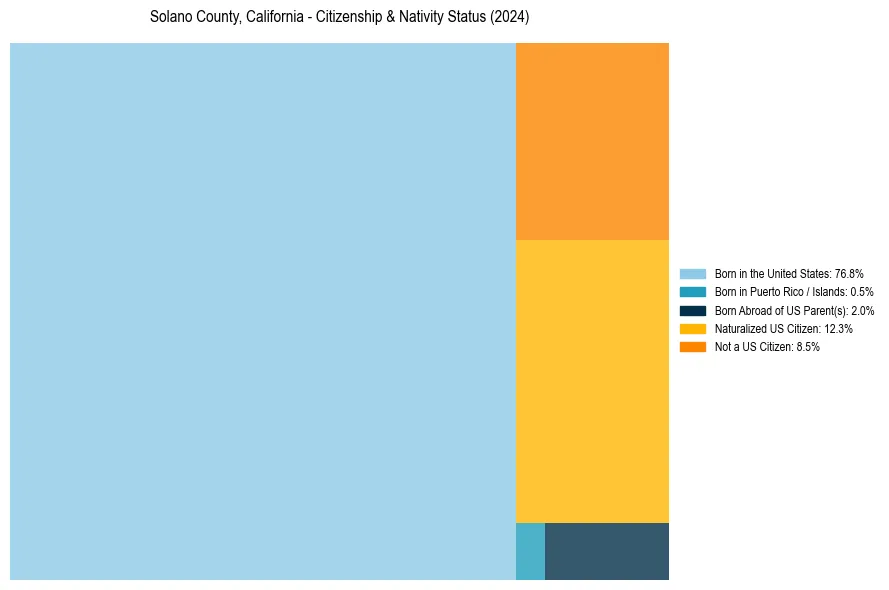
Solano County, California Nativity & Citizenship Distribution
Solano County, California Historical Nativity Trends (2010–2024)
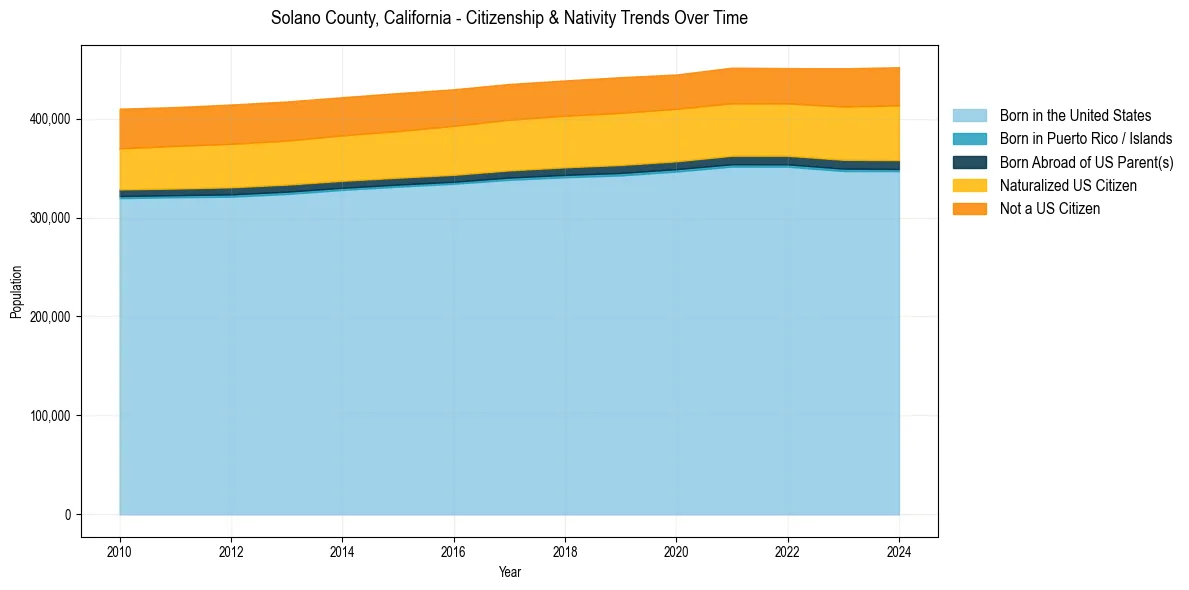
Solano County, California Population & Nativity History
| Year | Total Pop | Foreign Born | Native Born |
|---|---|---|---|
| 2024 | 451,918 | 20.8% | 79.2% |
| 2023 | 450,824 | 20.5% | 79.5% |
| 2022 | 450,995 | 19.6% | 80.4% |
| 2021 | 451,432 | 19.7% | 80.3% |
| 2020 | 444,538 | 19.7% | 80.3% |
| 2019 | 441,829 | 20.1% | 79.9% |
| 2018 | 438,530 | 20.0% | 80.0% |
| 2017 | 434,981 | 20.1% | 79.9% |
| 2016 | 429,596 | 20.1% | 79.9% |
| 2015 | 425,753 | 20.1% | 79.9% |
| 2014 | 421,624 | 20.0% | 80.0% |
| 2013 | 417,258 | 20.1% | 79.9% |
| 2012 | 414,209 | 20.2% | 79.8% |
| 2011 | 411,620 | 20.0% | 80.0% |
| 2010 | 410,042 | 19.9% | 80.1% |
Nativity & Citizenship FAQs for Solano County, California
Approximately 20.8% of residents in Solano County, California were born outside the United States.
The vast majority of residents, roughly 91.5%, are U.S. citizens (including both native-born and naturalized citizens).