Sonoma County, California Nativity & Citizenship Status (2024)
Place of birth and citizenship status analysis for Sonoma County, California
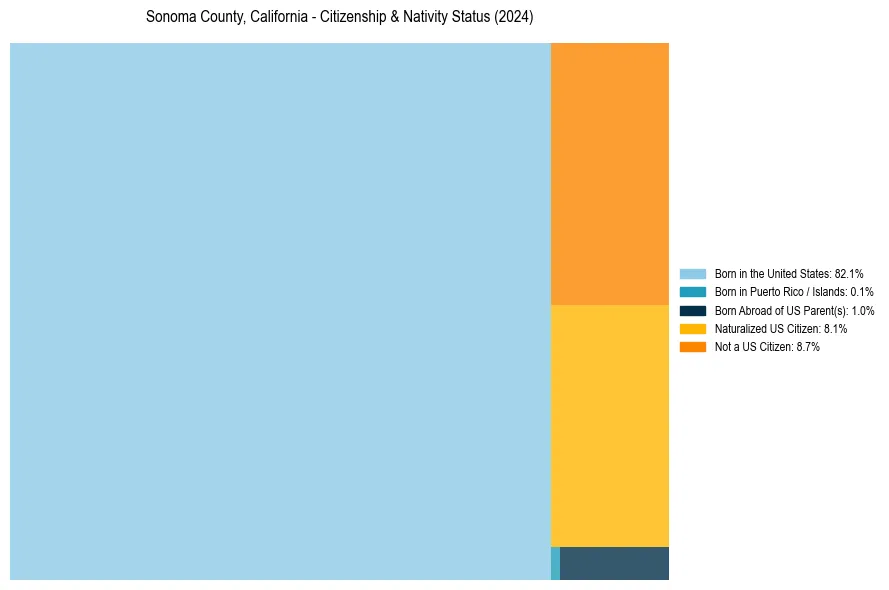
Sonoma County, California Nativity & Citizenship Indicators (2024)
Native Born
83.2%
Foreign Born
16.8%
Naturalized
8.1%
US Citizens
91.3%
Sonoma County, California Nativity & Citizenship Distribution
Sonoma County, California Historical Nativity Trends (2010–2024)
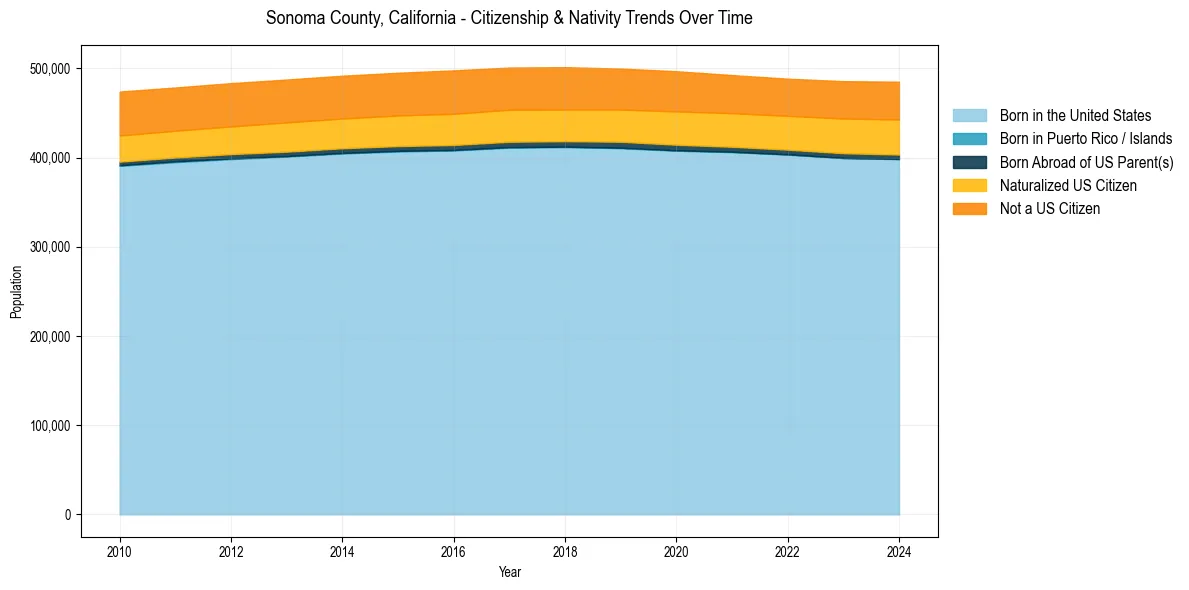
Sonoma County, California Population & Nativity History
| Year | Total Pop | Foreign Born | Native Born |
|---|---|---|---|
| 2024 | 485,040 | 16.8% | 83.2% |
| 2023 | 485,642 | 16.6% | 83.4% |
| 2022 | 488,436 | 16.3% | 83.7% |
| 2021 | 492,498 | 16.3% | 83.7% |
| 2020 | 496,801 | 16.6% | 83.4% |
| 2019 | 499,772 | 16.4% | 83.6% |
| 2018 | 501,317 | 16.5% | 83.5% |
| 2017 | 500,943 | 16.6% | 83.4% |
| 2016 | 497,776 | 16.8% | 83.2% |
| 2015 | 495,078 | 16.6% | 83.4% |
| 2014 | 491,790 | 16.5% | 83.5% |
| 2013 | 487,469 | 16.6% | 83.4% |
| 2012 | 483,456 | 16.5% | 83.5% |
| 2011 | 478,551 | 16.4% | 83.6% |
| 2010 | 474,047 | 16.6% | 83.4% |
Nativity & Citizenship FAQs for Sonoma County, California
Approximately 16.8% of residents in Sonoma County, California were born outside the United States.
The vast majority of residents, roughly 91.3%, are U.S. citizens (including both native-born and naturalized citizens).