Sutter County, California Nativity & Citizenship Status (2024)
Place of birth and citizenship status analysis for Sutter County, California
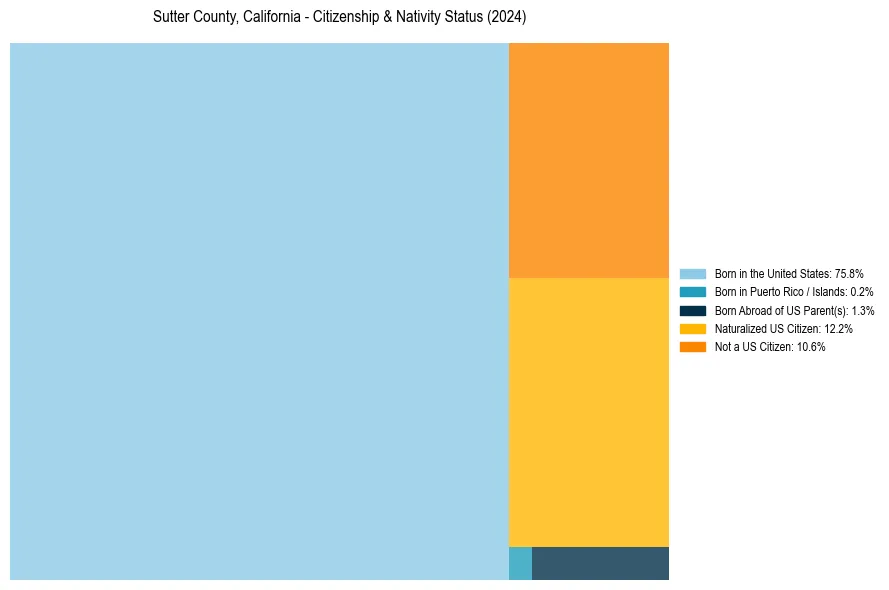
Sutter County, California Nativity & Citizenship Indicators (2024)
Native Born
77.3%
Foreign Born
22.7%
Naturalized
12.2%
US Citizens
89.4%
Sutter County, California Nativity & Citizenship Distribution
Sutter County, California Historical Nativity Trends (2010–2024)
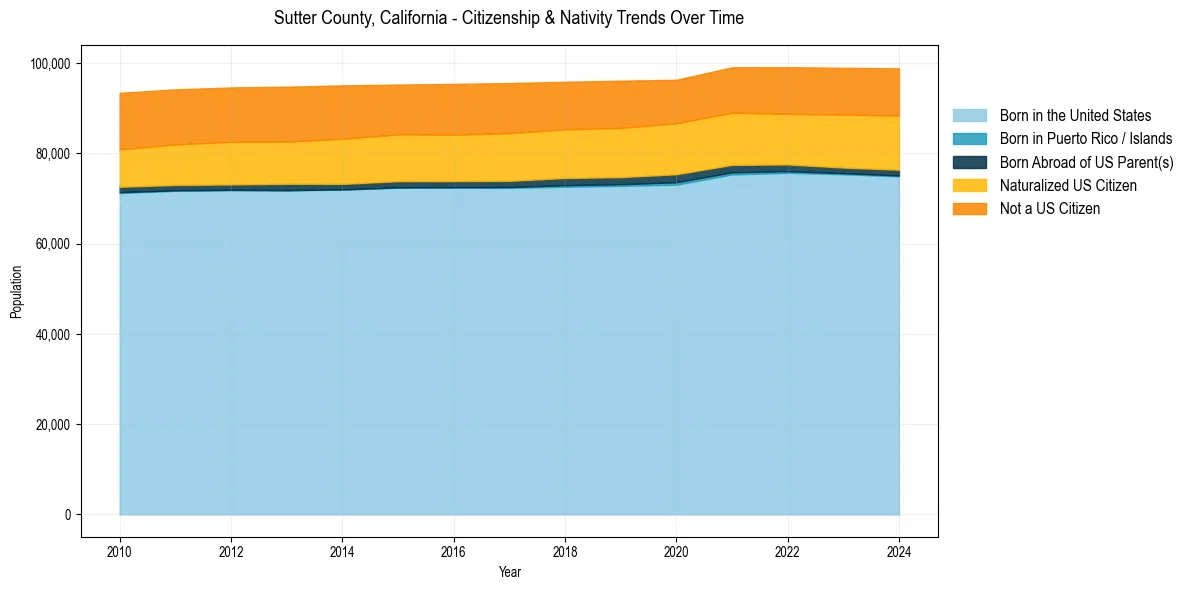
Sutter County, California Population & Nativity History
| Year | Total Pop | Foreign Born | Native Born |
|---|---|---|---|
| 2024 | 98,857 | 22.7% | 77.3% |
| 2023 | 98,971 | 22.3% | 77.7% |
| 2022 | 99,101 | 21.7% | 78.3% |
| 2021 | 99,080 | 21.8% | 78.2% |
| 2020 | 96,315 | 21.7% | 78.3% |
| 2019 | 96,109 | 22.2% | 77.8% |
| 2018 | 95,872 | 22.2% | 77.8% |
| 2017 | 95,583 | 22.7% | 77.3% |
| 2016 | 95,406 | 22.6% | 77.4% |
| 2015 | 95,247 | 22.5% | 77.5% |
| 2014 | 95,067 | 23.0% | 77.0% |
| 2013 | 94,787 | 22.7% | 77.3% |
| 2012 | 94,615 | 22.7% | 77.3% |
| 2011 | 94,192 | 22.5% | 77.5% |
| 2010 | 93,420 | 22.3% | 77.7% |
Nativity & Citizenship FAQs for Sutter County, California
Approximately 22.7% of residents in Sutter County, California were born outside the United States.
The vast majority of residents, roughly 89.4%, are U.S. citizens (including both native-born and naturalized citizens).