Tulare County, California Nativity & Citizenship Status (2024)
Place of birth and citizenship status analysis for Tulare County, California
Tulare County, California Nativity & Citizenship Indicators (2024)
Native Born
77.8%
Foreign Born
22.2%
Naturalized
8.4%
US Citizens
86.2%
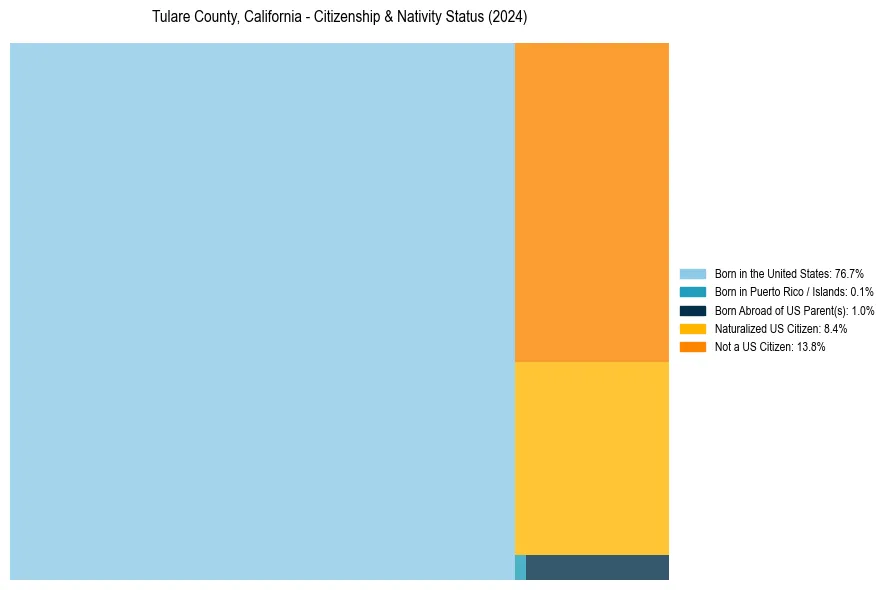
Tulare County, California Nativity & Citizenship Distribution
Tulare County, California Historical Nativity Trends (2010–2024)
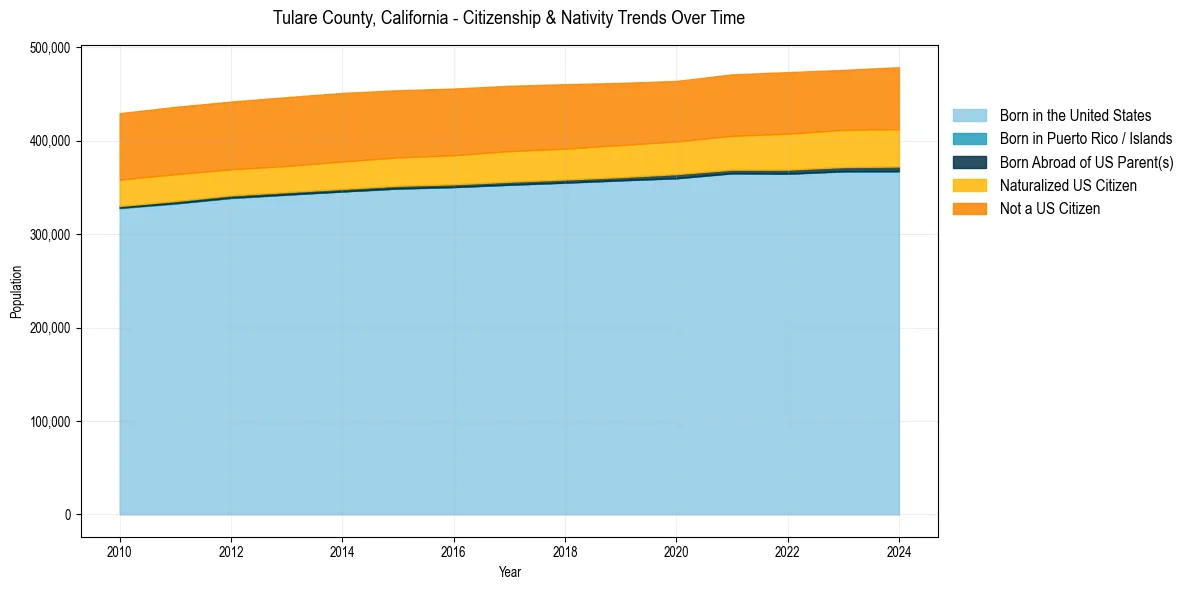
Tulare County, California Population & Nativity History
| Year | Total Pop | Foreign Born | Native Born |
|---|---|---|---|
| 2024 | 478,693 | 22.2% | 77.8% |
| 2023 | 475,774 | 21.9% | 78.1% |
| 2022 | 473,446 | 22.1% | 77.9% |
| 2021 | 470,999 | 21.7% | 78.3% |
| 2020 | 463,955 | 21.5% | 78.5% |
| 2019 | 461,898 | 21.8% | 78.2% |
| 2018 | 460,477 | 22.2% | 77.8% |
| 2017 | 458,809 | 22.4% | 77.6% |
| 2016 | 455,769 | 22.5% | 77.5% |
| 2015 | 454,033 | 22.5% | 77.5% |
| 2014 | 451,108 | 22.8% | 77.2% |
| 2013 | 446,644 | 22.8% | 77.2% |
| 2012 | 441,877 | 22.7% | 77.3% |
| 2011 | 436,234 | 23.1% | 76.9% |
| 2010 | 429,404 | 23.1% | 76.9% |
Nativity & Citizenship FAQs for Tulare County, California
Approximately 22.2% of residents in Tulare County, California were born outside the United States.
The vast majority of residents, roughly 86.2%, are U.S. citizens (including both native-born and naturalized citizens).