Ventura County, California Nativity & Citizenship Status (2024)
Place of birth and citizenship status analysis for Ventura County, California
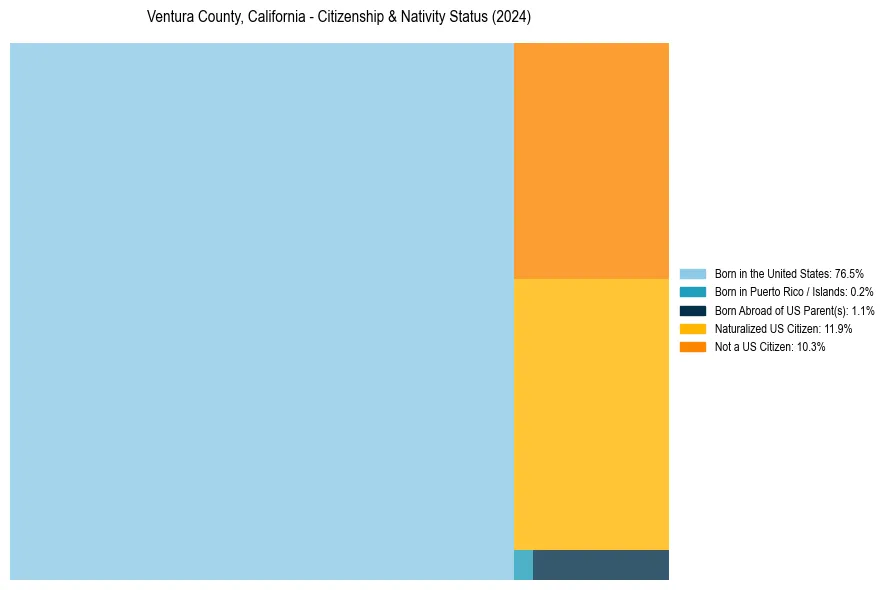
Ventura County, California Nativity & Citizenship Indicators (2024)
Native Born
77.8%
Foreign Born
22.2%
Naturalized
11.9%
US Citizens
89.7%
Ventura County, California Nativity & Citizenship Distribution
Ventura County, California Historical Nativity Trends (2010–2024)
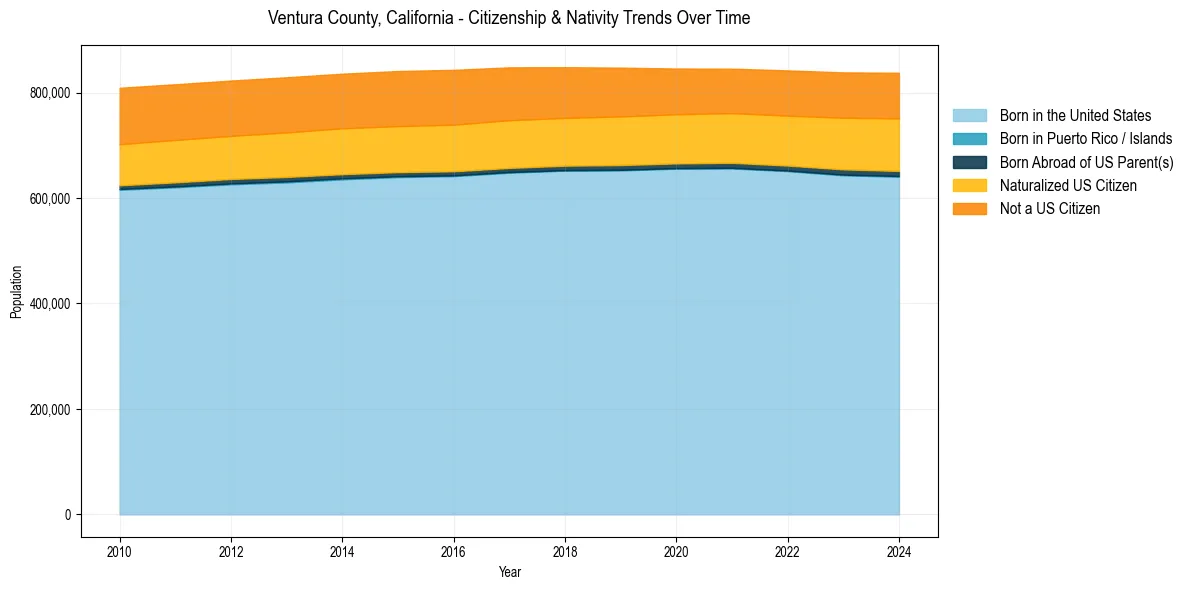
Ventura County, California Population & Nativity History
| Year | Total Pop | Foreign Born | Native Born |
|---|---|---|---|
| 2024 | 837,469 | 22.2% | 77.8% |
| 2023 | 838,259 | 21.9% | 78.1% |
| 2022 | 842,009 | 21.4% | 78.6% |
| 2021 | 845,255 | 21.1% | 78.9% |
| 2020 | 845,599 | 21.3% | 78.7% |
| 2019 | 847,263 | 21.8% | 78.2% |
| 2018 | 848,112 | 22.0% | 78.0% |
| 2017 | 847,834 | 22.5% | 77.5% |
| 2016 | 843,110 | 22.8% | 77.2% |
| 2015 | 840,833 | 22.8% | 77.2% |
| 2014 | 835,790 | 22.8% | 77.2% |
| 2013 | 829,017 | 22.8% | 77.2% |
| 2012 | 822,794 | 22.7% | 77.3% |
| 2011 | 815,745 | 22.8% | 77.2% |
| 2010 | 809,080 | 22.9% | 77.1% |
Nativity & Citizenship FAQs for Ventura County, California
Approximately 22.2% of residents in Ventura County, California were born outside the United States.
The vast majority of residents, roughly 89.7%, are U.S. citizens (including both native-born and naturalized citizens).