Yuba County, California Nativity & Citizenship Status (2024)
Place of birth and citizenship status analysis for Yuba County, California
Yuba County, California Nativity & Citizenship Indicators (2024)
Native Born
88.5%
Foreign Born
11.5%
Naturalized
6.6%
US Citizens
95.1%
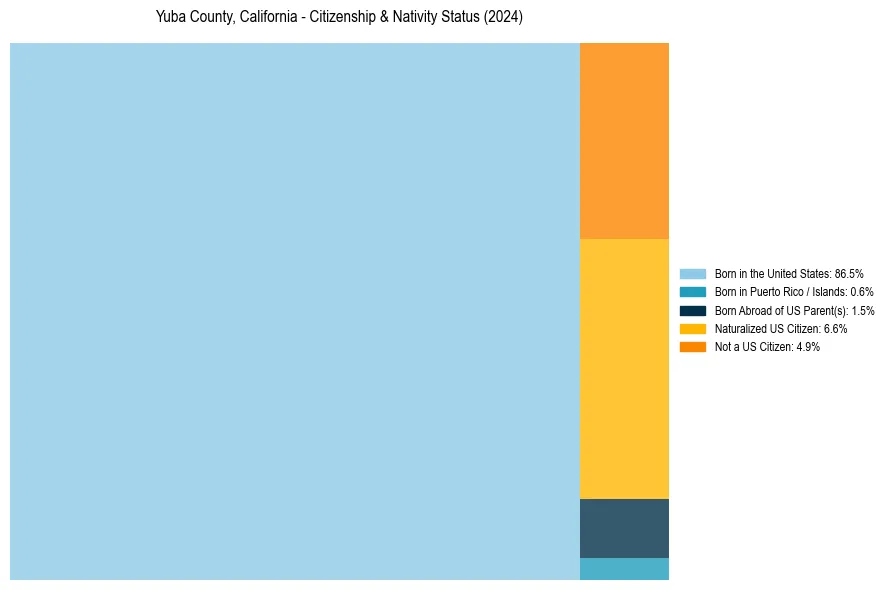
Yuba County, California Nativity & Citizenship Distribution
Yuba County, California Historical Nativity Trends (2010–2024)
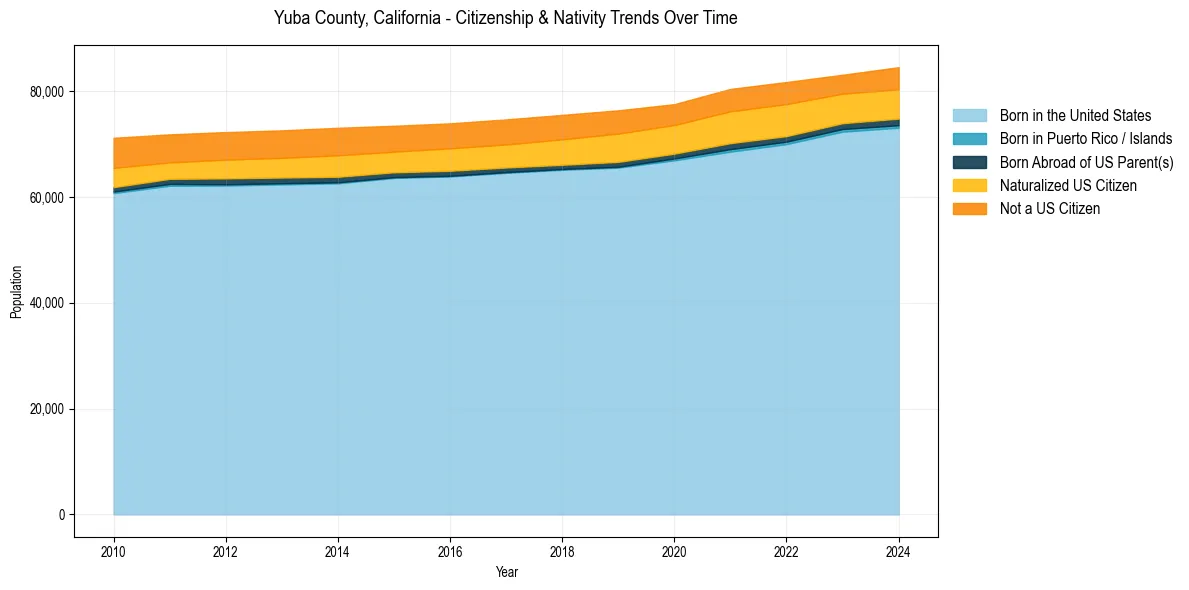
Yuba County, California Population & Nativity History
| Year | Total Pop | Foreign Born | Native Born |
|---|---|---|---|
| 2024 | 84,507 | 11.5% | 88.5% |
| 2023 | 83,079 | 11.0% | 89.0% |
| 2022 | 81,705 | 12.5% | 87.5% |
| 2021 | 80,404 | 12.7% | 87.3% |
| 2020 | 77,524 | 12.1% | 87.9% |
| 2019 | 76,360 | 12.8% | 87.2% |
| 2018 | 75,493 | 12.5% | 87.5% |
| 2017 | 74,644 | 12.2% | 87.8% |
| 2016 | 73,897 | 12.1% | 87.9% |
| 2015 | 73,437 | 12.0% | 88.0% |
| 2014 | 73,059 | 12.7% | 87.3% |
| 2013 | 72,574 | 12.3% | 87.7% |
| 2012 | 72,244 | 12.1% | 87.9% |
| 2011 | 71,817 | 11.7% | 88.3% |
| 2010 | 71,160 | 13.1% | 86.9% |
Nativity & Citizenship FAQs for Yuba County, California
Approximately 11.5% of residents in Yuba County, California were born outside the United States.
The vast majority of residents, roughly 95.1%, are U.S. citizens (including both native-born and naturalized citizens).