Delaware Age & Gender Distribution (2024)
Population distribution by age and gender for Delaware
Delaware Age & Gender Statistics (2024)
Total Population
1,021,191
Median Age
41.6
Male Median
40.1
Female Median
43.0
Delaware Population Growth
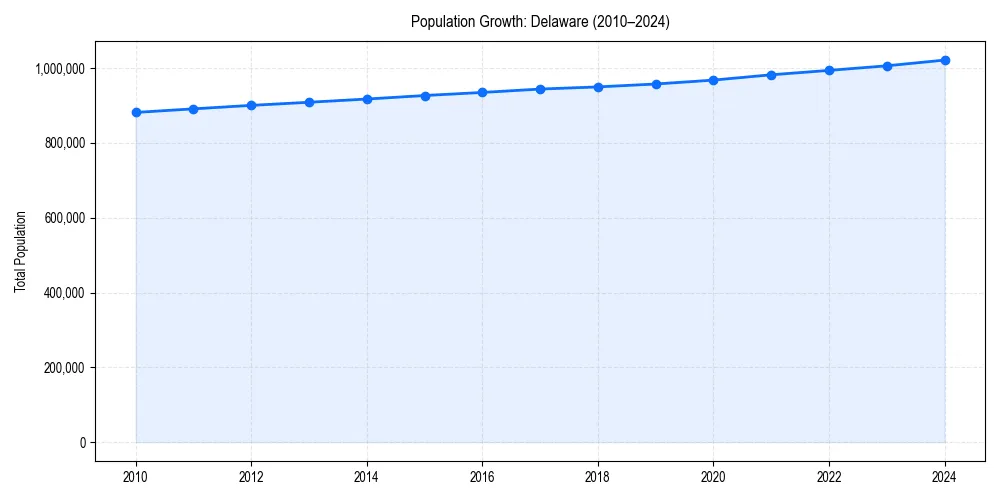
Delaware Demographic Trend
Since 2010, the population of has changed by +15.9%%.
+15.9%% Growth
Delaware Age & Gender Pyramid
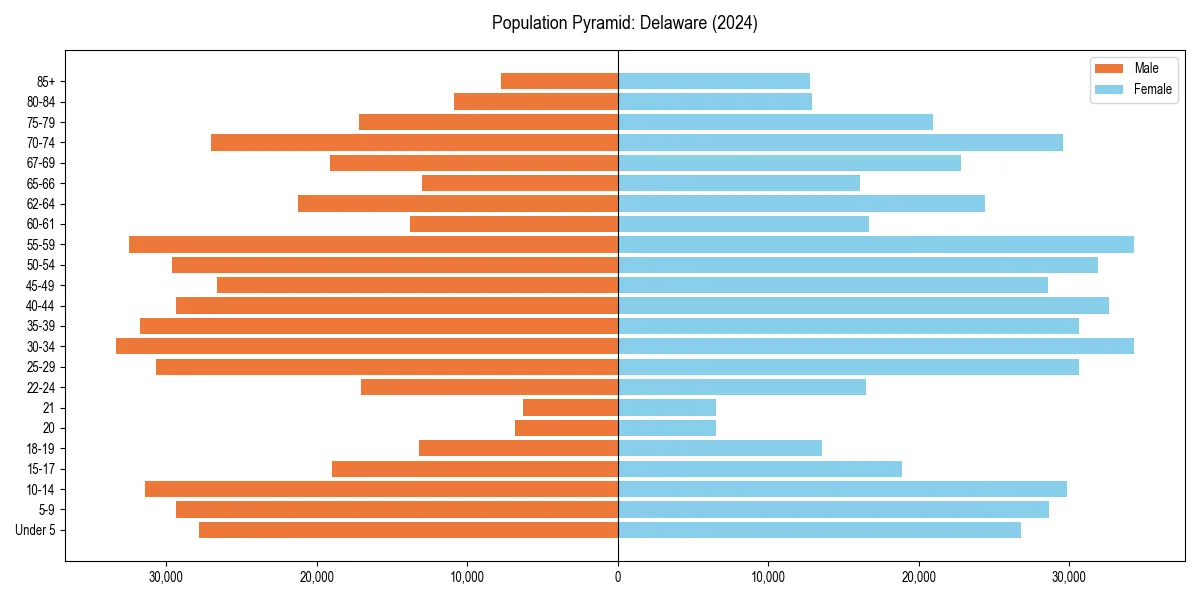
Figure 2: Population distribution by age and gender for 2024.
Delaware Historical Population Data
| Year | Median Age | Population |
|---|---|---|
| 2024 | 41.6 | 1,021,191 |
| 2023 | 41.5 | 1,005,872 |
| 2022 | 41.4 | 993,635 |
| 2021 | 41.1 | 981,892 |
| 2020 | 41.0 | 967,679 |
| 2019 | 40.6 | 957,248 |
| 2018 | 40.2 | 949,495 |
| 2017 | 39.8 | 943,732 |
| 2016 | 39.6 | 934,695 |
| 2015 | 39.3 | 926,454 |
| 2014 | 39.1 | 917,060 |
| 2013 | 38.9 | 908,446 |
| 2012 | 38.7 | 900,131 |
| 2011 | 38.6 | 890,856 |
| 2010 | 38.3 | 881,278 |
Delaware Age Group Breakdown (2024)
| Age Cohort | Percentage |
|---|---|
| Under 5 | 5.3% |
| 5–17 | 15.4% |
| 18–24 | 8.5% |
| 25–34 | 12.6% |
| 35–54 | 23.6% |
| 55–64 | 14.0% |
| 65+ | 20.6% |
Dependency Ratios for Delaware
- Total Dependency Ratio:
- 70.4
- Youth Dependency:
- 35.3
- Old-Age Dependency:
- 35.1
The dependency ratio measures dependents (ages 0-17 and 65+) per 100 working-age individuals (ages 18-64).
Age & Gender FAQs for Delaware
The median age in Delaware is 41.6 years.
According to latest Census data, the total population of Delaware is 1,021,191.
In Delaware, seniors (ages 65+) make up 20.6% of the population, while children under 18 represent 15.4%.
Based on historical data since 2010, the population in Delaware is aging.