Alachua County, Florida Nativity & Citizenship Status (2024)
Place of birth and citizenship status analysis for Alachua County, Florida
Alachua County, Florida Nativity & Citizenship Indicators (2024)
Native Born
88.4%
Foreign Born
11.6%
Naturalized
6.4%
US Citizens
94.8%
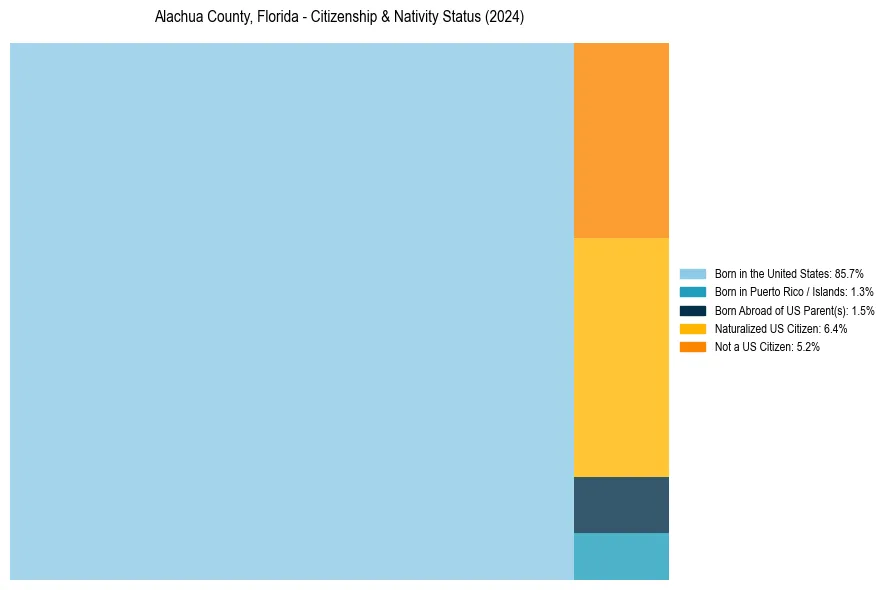
Alachua County, Florida Nativity & Citizenship Distribution
Alachua County, Florida Historical Nativity Trends (2010–2024)
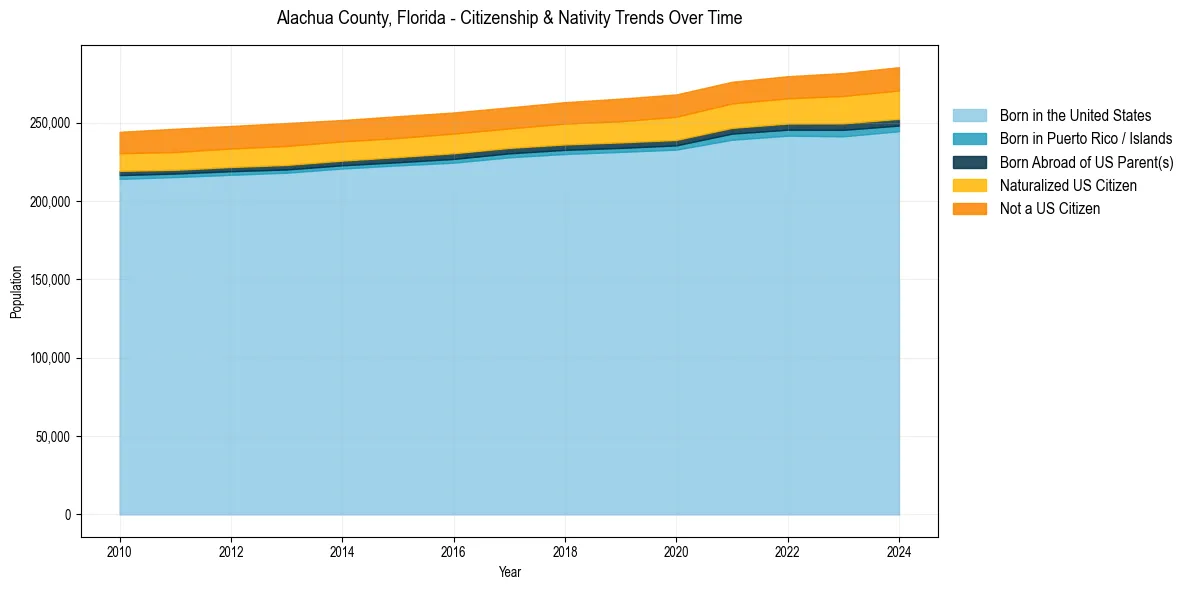
Alachua County, Florida Population & Nativity History
| Year | Total Pop | Foreign Born | Native Born |
|---|---|---|---|
| 2024 | 285,492 | 11.6% | 88.4% |
| 2023 | 281,751 | 11.4% | 88.6% |
| 2022 | 279,729 | 10.8% | 89.2% |
| 2021 | 276,171 | 10.7% | 89.3% |
| 2020 | 268,105 | 10.8% | 89.2% |
| 2019 | 265,443 | 10.5% | 89.5% |
| 2018 | 263,148 | 10.3% | 89.7% |
| 2017 | 259,865 | 10.0% | 90.0% |
| 2016 | 256,581 | 10.1% | 89.9% |
| 2015 | 254,218 | 10.3% | 89.7% |
| 2014 | 251,759 | 10.3% | 89.7% |
| 2013 | 249,848 | 10.7% | 89.3% |
| 2012 | 247,973 | 10.6% | 89.4% |
| 2011 | 246,203 | 10.7% | 89.3% |
| 2010 | 244,247 | 10.2% | 89.8% |
Nativity & Citizenship FAQs for Alachua County, Florida
Approximately 11.6% of residents in Alachua County, Florida were born outside the United States.
The vast majority of residents, roughly 94.8%, are U.S. citizens (including both native-born and naturalized citizens).