Broward County, Florida Nativity & Citizenship Status (2024)
Place of birth and citizenship status analysis for Broward County, Florida
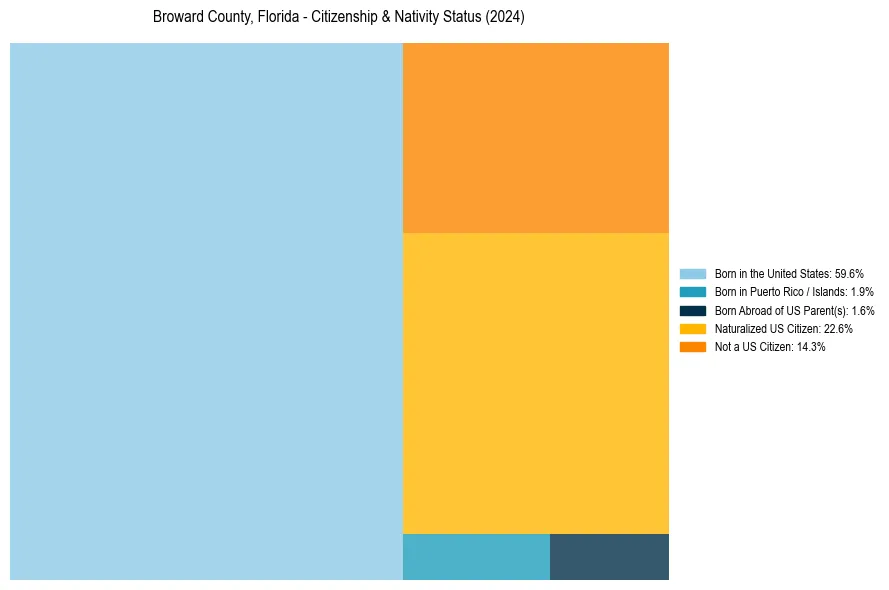
Broward County, Florida Nativity & Citizenship Indicators (2024)
Native Born
63.1%
Foreign Born
36.9%
Naturalized
22.6%
US Citizens
85.7%
Broward County, Florida Nativity & Citizenship Distribution
Broward County, Florida Historical Nativity Trends (2010–2024)
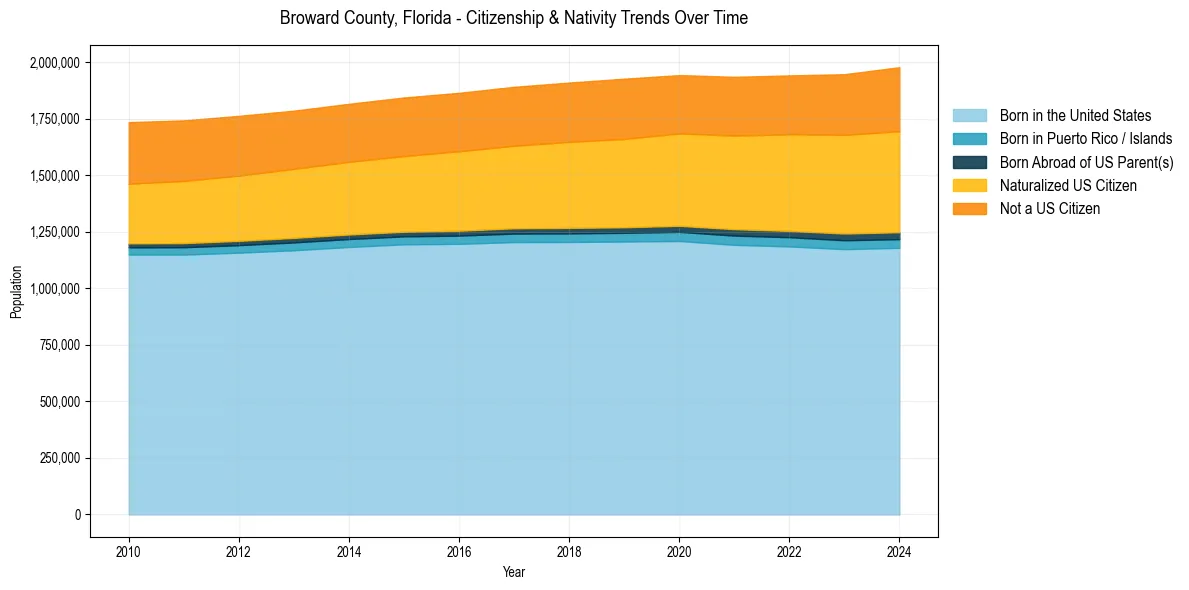
Broward County, Florida Population & Nativity History
| Year | Total Pop | Foreign Born | Native Born |
|---|---|---|---|
| 2024 | 1,977,129 | 36.9% | 63.1% |
| 2023 | 1,946,127 | 36.2% | 63.8% |
| 2022 | 1,940,907 | 35.4% | 64.6% |
| 2021 | 1,934,551 | 34.8% | 65.2% |
| 2020 | 1,942,273 | 34.3% | 65.7% |
| 2019 | 1,926,205 | 34.1% | 65.9% |
| 2018 | 1,909,151 | 33.7% | 66.3% |
| 2017 | 1,890,416 | 33.1% | 66.9% |
| 2016 | 1,863,780 | 32.7% | 67.3% |
| 2015 | 1,843,152 | 32.2% | 67.8% |
| 2014 | 1,815,269 | 31.8% | 68.2% |
| 2013 | 1,784,889 | 31.5% | 68.5% |
| 2012 | 1,761,993 | 31.4% | 68.6% |
| 2011 | 1,742,012 | 31.2% | 68.8% |
| 2010 | 1,734,139 | 30.9% | 69.1% |
Nativity & Citizenship FAQs for Broward County, Florida
Approximately 36.9% of residents in Broward County, Florida were born outside the United States.
The vast majority of residents, roughly 85.7%, are U.S. citizens (including both native-born and naturalized citizens).