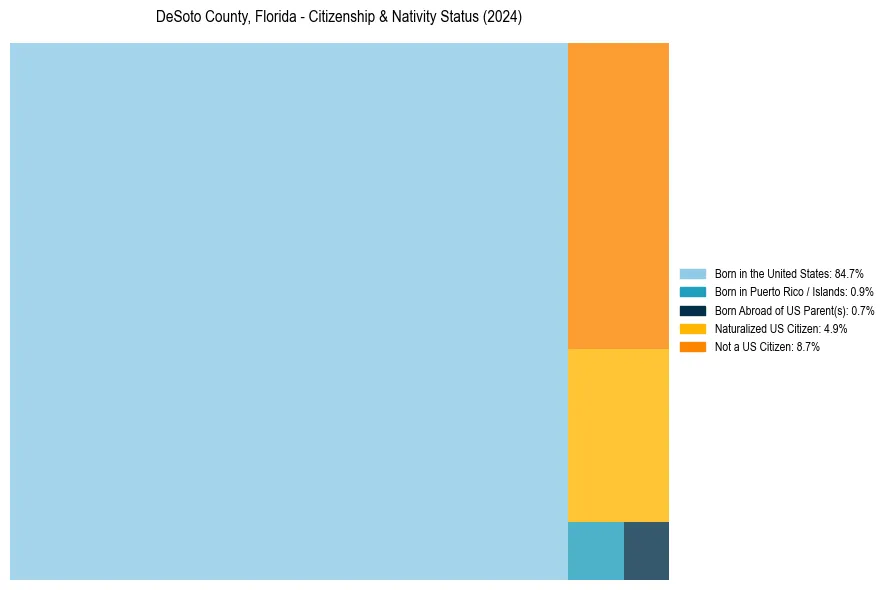
DeSoto County, Florida Nativity & Citizenship Status (2024)
Place of birth and citizenship status analysis for DeSoto County, Florida
DeSoto County, Florida Nativity & Citizenship Indicators (2024)
Native Born
86.4%
Foreign Born
13.6%
Naturalized
4.9%
US Citizens
91.3%
DeSoto County, Florida Nativity & Citizenship Distribution
DeSoto County, Florida Historical Nativity Trends (2010–2024)
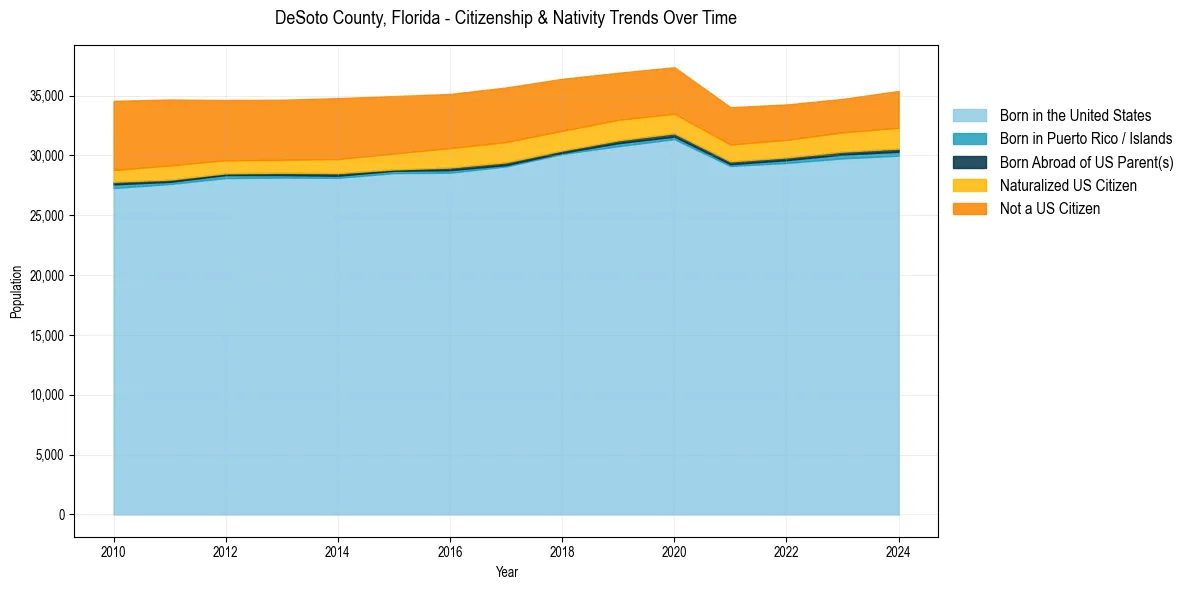
DeSoto County, Florida Population & Nativity History
| Year | Total Pop | Foreign Born | Native Born |
|---|---|---|---|
| 2024 | 35,386 | 13.6% | 86.4% |
| 2023 | 34,719 | 12.7% | 87.3% |
| 2022 | 34,258 | 12.9% | 87.1% |
| 2021 | 34,027 | 13.3% | 86.7% |
| 2020 | 37,371 | 14.8% | 85.2% |
| 2019 | 36,903 | 15.3% | 84.7% |
| 2018 | 36,399 | 16.5% | 83.5% |
| 2017 | 35,675 | 17.5% | 82.5% |
| 2016 | 35,134 | 17.5% | 82.5% |
| 2015 | 34,957 | 17.5% | 82.5% |
| 2014 | 34,785 | 18.0% | 82.0% |
| 2013 | 34,651 | 17.6% | 82.4% |
| 2012 | 34,628 | 17.7% | 82.3% |
| 2011 | 34,669 | 19.3% | 80.7% |
| 2010 | 34,557 | 19.6% | 80.4% |
Nativity & Citizenship FAQs for DeSoto County, Florida
Approximately 13.6% of residents in DeSoto County, Florida were born outside the United States.
The vast majority of residents, roughly 91.3%, are U.S. citizens (including both native-born and naturalized citizens).