Hernando County, Florida Nativity & Citizenship Status (2024)
Place of birth and citizenship status analysis for Hernando County, Florida
Hernando County, Florida Nativity & Citizenship Indicators (2024)
Native Born
91.6%
Foreign Born
8.4%
Naturalized
5.7%
US Citizens
97.3%
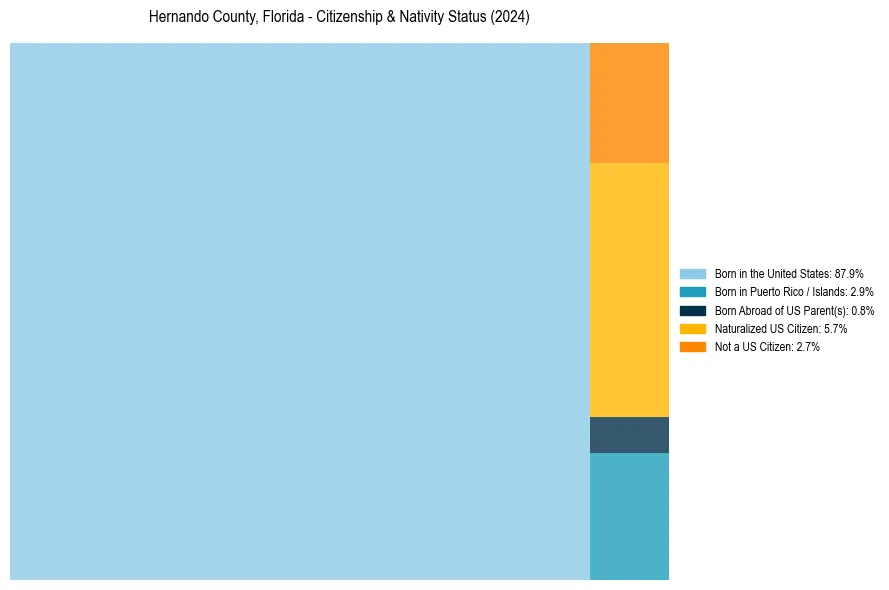
Hernando County, Florida Nativity & Citizenship Distribution
Hernando County, Florida Historical Nativity Trends (2010–2024)
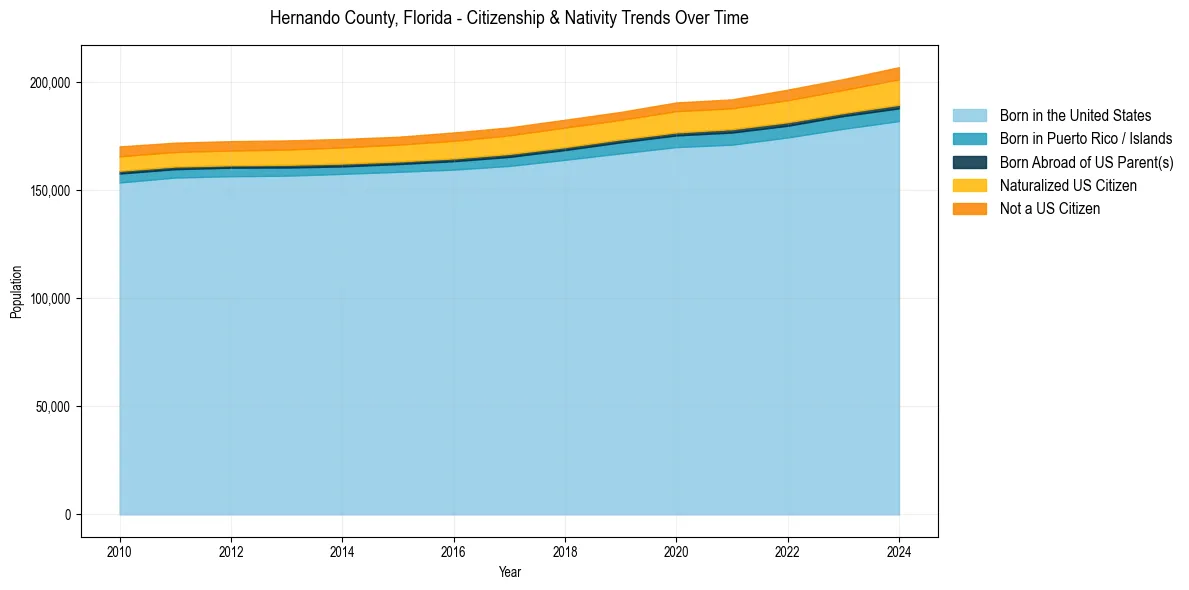
Hernando County, Florida Population & Nativity History
| Year | Total Pop | Foreign Born | Native Born |
|---|---|---|---|
| 2024 | 207,018 | 8.4% | 91.6% |
| 2023 | 201,512 | 7.8% | 92.2% |
| 2022 | 196,621 | 7.7% | 92.3% |
| 2021 | 192,128 | 7.2% | 92.8% |
| 2020 | 190,700 | 7.3% | 92.7% |
| 2019 | 186,313 | 6.8% | 93.2% |
| 2018 | 182,696 | 6.9% | 93.1% |
| 2017 | 179,144 | 6.9% | 93.1% |
| 2016 | 176,797 | 6.8% | 93.2% |
| 2015 | 174,809 | 6.5% | 93.5% |
| 2014 | 173,792 | 6.6% | 93.4% |
| 2013 | 173,119 | 6.5% | 93.5% |
| 2012 | 172,784 | 6.5% | 93.5% |
| 2011 | 172,079 | 6.4% | 93.6% |
| 2010 | 170,337 | 6.6% | 93.4% |
Nativity & Citizenship FAQs for Hernando County, Florida
Approximately 8.4% of residents in Hernando County, Florida were born outside the United States.
The vast majority of residents, roughly 97.3%, are U.S. citizens (including both native-born and naturalized citizens).