Hillsborough County, Florida Health Insurance Coverage (2024)
Detailed analysis of uninsured rates and coverage trends for Hillsborough County, Florida
Universe
1,507,677
Total Uninsured
167,911
Uninsured Rate
11.1%
Coverage by Age and Gender
Distribution of insured vs. uninsured residents in Hillsborough County, Florida
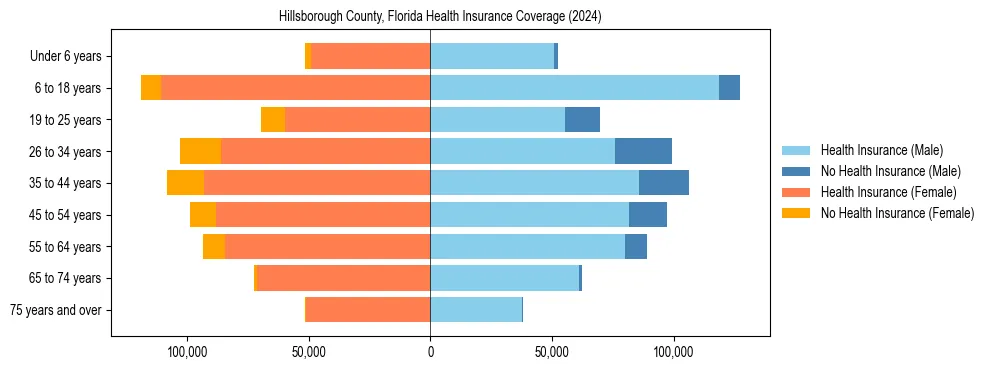
Uninsured Rates by Demographic Group
Under 18 Years
Male Uninsured5.6%
Female Uninsured6.2%
18 to 34 Years
Male Uninsured22.5%
Female Uninsured15.5%
35 to 64 Years
Male Uninsured15.5%
Female Uninsured11.5%
65 Years & Over
Male Uninsured1.5%
Female Uninsured1.2%
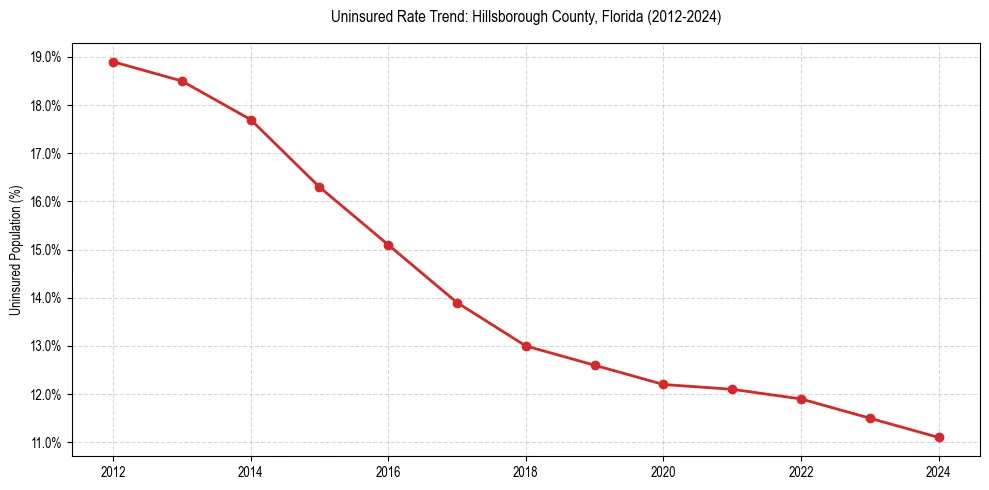
Uninsured Rate Trends
Historical coverage data from 2012 to 2024
| Year | Total Uninsured | Uninsured Rate |
|---|---|---|
| 2024 | 167,911 | 11.1% |
| 2023 | 168,864 | 11.5% |
| 2022 | 173,403 | 11.9% |
| 2021 | 173,496 | 12.1% |
| 2020 | 176,212 | 12.2% |
| 2019 | 177,721 | 12.6% |
| 2018 | 178,122 | 13.0% |
| 2017 | 186,640 | 13.9% |
| 2016 | 197,433 | 15.1% |
| 2015 | 210,722 | 16.3% |
| 2014 | 224,025 | 17.7% |
| 2013 | 230,256 | 18.5% |
| 2012 | 231,150 | 18.9% |
Frequently Asked Questions
Approximately 11.1% of the population in Hillsborough County, Florida does not have health insurance coverage.
In Hillsborough County, Florida, young adult males (18-34) face the highest barrier to coverage, with an uninsured rate of 22.5%. This is notably higher than the overall local average of 11.1%.