Hillsborough County, Florida Nativity & Citizenship Status (2024)
Place of birth and citizenship status analysis for Hillsborough County, Florida
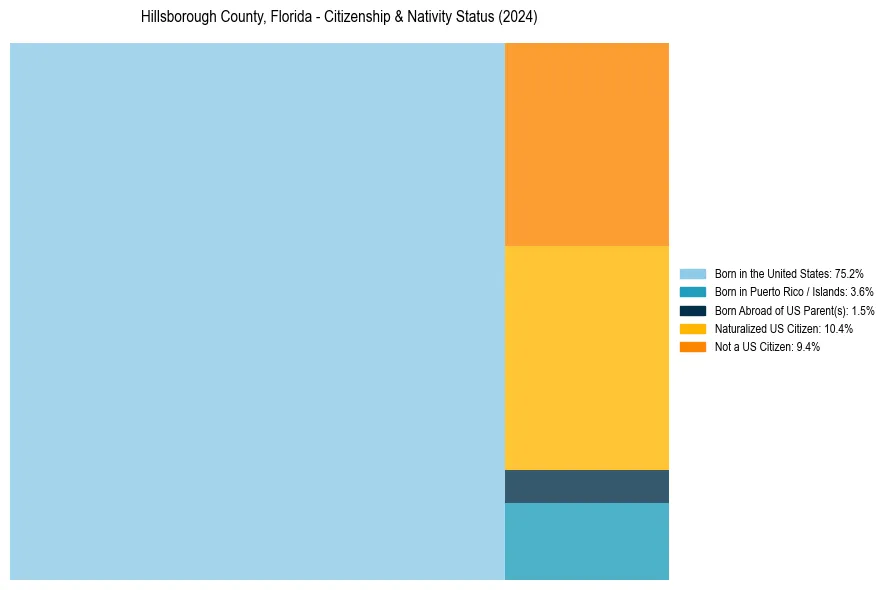
Hillsborough County, Florida Nativity & Citizenship Indicators (2024)
Native Born
80.3%
Foreign Born
19.7%
Naturalized
10.4%
US Citizens
90.6%
Hillsborough County, Florida Nativity & Citizenship Distribution
Hillsborough County, Florida Historical Nativity Trends (2010–2024)
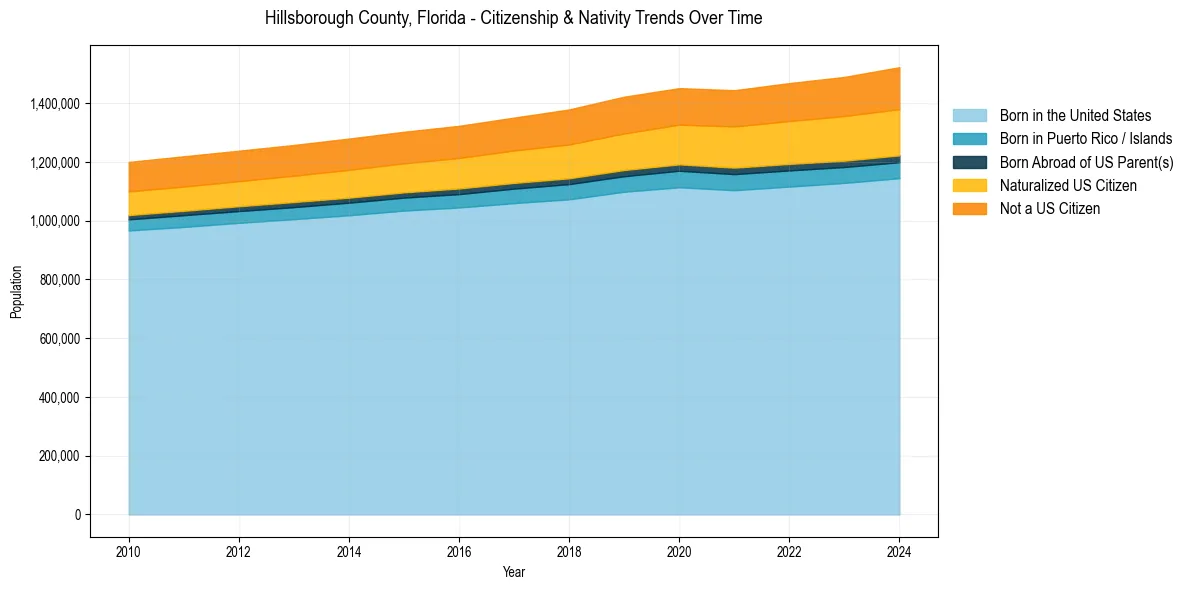
Hillsborough County, Florida Population & Nativity History
| Year | Total Pop | Foreign Born | Native Born |
|---|---|---|---|
| 2024 | 1,522,748 | 19.7% | 80.3% |
| 2023 | 1,489,634 | 19.2% | 80.8% |
| 2022 | 1,468,560 | 18.7% | 81.3% |
| 2021 | 1,444,359 | 18.3% | 81.7% |
| 2020 | 1,451,358 | 17.9% | 82.1% |
| 2019 | 1,422,278 | 17.6% | 82.4% |
| 2018 | 1,378,883 | 17.0% | 83.0% |
| 2017 | 1,351,087 | 16.5% | 83.5% |
| 2016 | 1,323,059 | 16.1% | 83.9% |
| 2015 | 1,302,884 | 15.8% | 84.2% |
| 2014 | 1,279,668 | 15.7% | 84.3% |
| 2013 | 1,257,913 | 15.5% | 84.5% |
| 2012 | 1,238,365 | 15.3% | 84.7% |
| 2011 | 1,219,331 | 15.2% | 84.8% |
| 2010 | 1,200,236 | 15.1% | 84.9% |
Nativity & Citizenship FAQs for Hillsborough County, Florida
Approximately 19.7% of residents in Hillsborough County, Florida were born outside the United States.
The vast majority of residents, roughly 90.6%, are U.S. citizens (including both native-born and naturalized citizens).