Lee County, Florida Nativity & Citizenship Status (2024)
Place of birth and citizenship status analysis for Lee County, Florida
Lee County, Florida Nativity & Citizenship Indicators (2024)
Native Born
81.1%
Foreign Born
18.9%
Naturalized
9.3%
US Citizens
90.4%
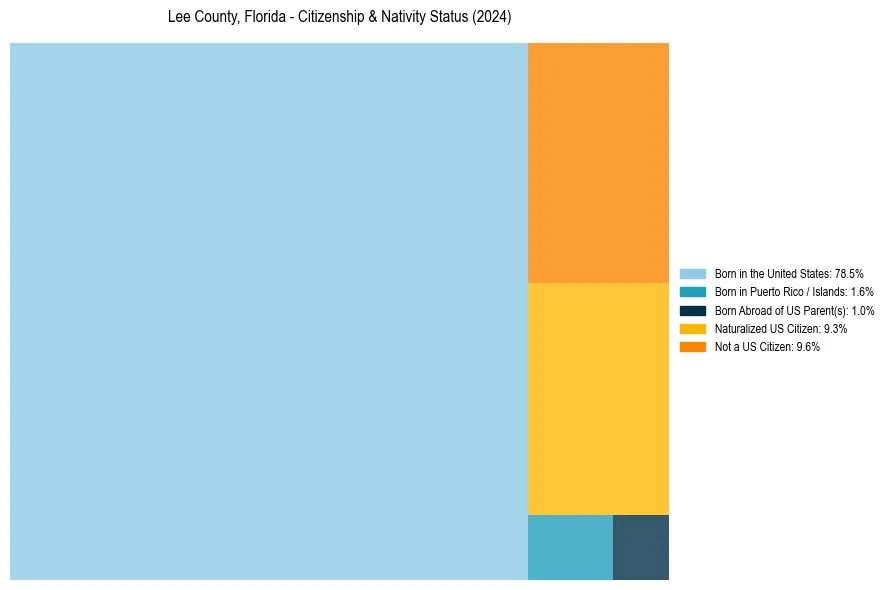
Lee County, Florida Nativity & Citizenship Distribution
Lee County, Florida Historical Nativity Trends (2010–2024)
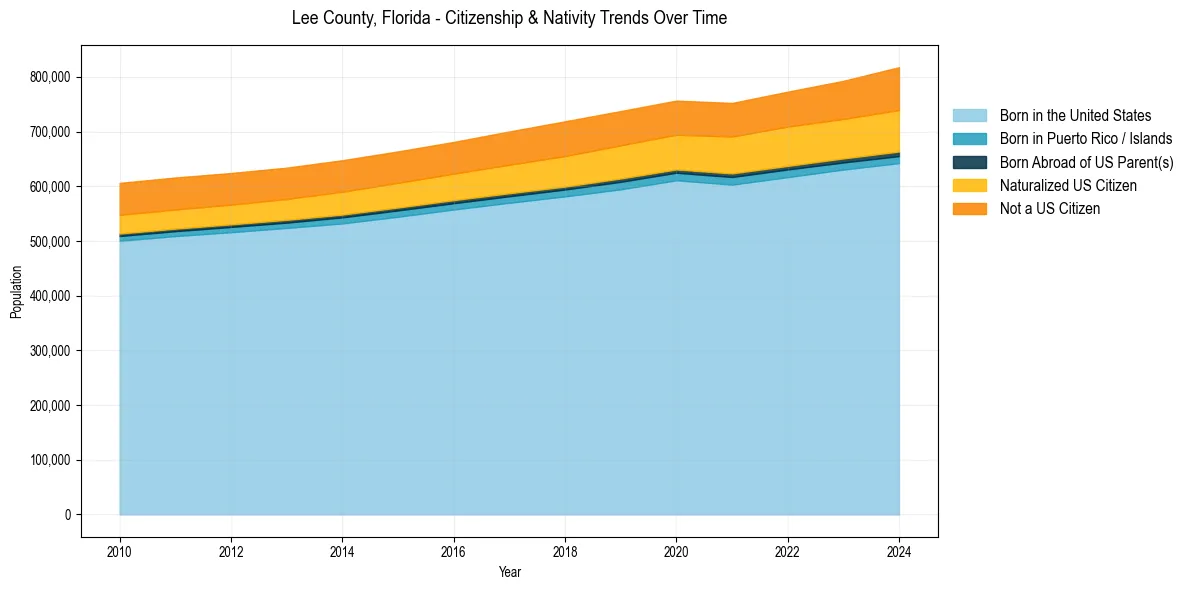
Lee County, Florida Population & Nativity History
| Year | Total Pop | Foreign Born | Native Born |
|---|---|---|---|
| 2024 | 817,666 | 18.9% | 81.1% |
| 2023 | 792,692 | 17.9% | 82.1% |
| 2022 | 772,902 | 17.6% | 82.4% |
| 2021 | 752,251 | 17.1% | 82.9% |
| 2020 | 756,570 | 16.6% | 83.4% |
| 2019 | 737,468 | 16.7% | 83.3% |
| 2018 | 718,679 | 16.6% | 83.4% |
| 2017 | 700,165 | 16.1% | 83.9% |
| 2016 | 680,970 | 15.6% | 84.4% |
| 2015 | 663,675 | 15.5% | 84.5% |
| 2014 | 647,554 | 15.4% | 84.6% |
| 2013 | 633,968 | 15.1% | 84.9% |
| 2012 | 624,155 | 15.0% | 85.0% |
| 2011 | 615,955 | 15.2% | 84.8% |
| 2010 | 606,165 | 15.3% | 84.7% |
Nativity & Citizenship FAQs for Lee County, Florida
Approximately 18.9% of residents in Lee County, Florida were born outside the United States.
The vast majority of residents, roughly 90.4%, are U.S. citizens (including both native-born and naturalized citizens).