Martin County, Florida Nativity & Citizenship Status (2024)
Place of birth and citizenship status analysis for Martin County, Florida
Martin County, Florida Nativity & Citizenship Indicators (2024)
Native Born
88.9%
Foreign Born
11.1%
Naturalized
6.1%
US Citizens
94.9%
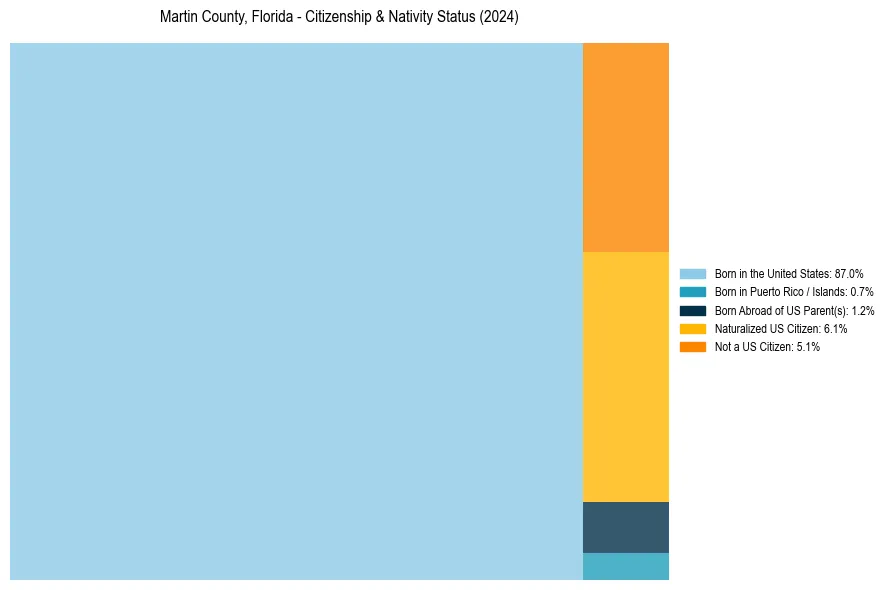
Martin County, Florida Nativity & Citizenship Distribution
Martin County, Florida Historical Nativity Trends (2010–2024)
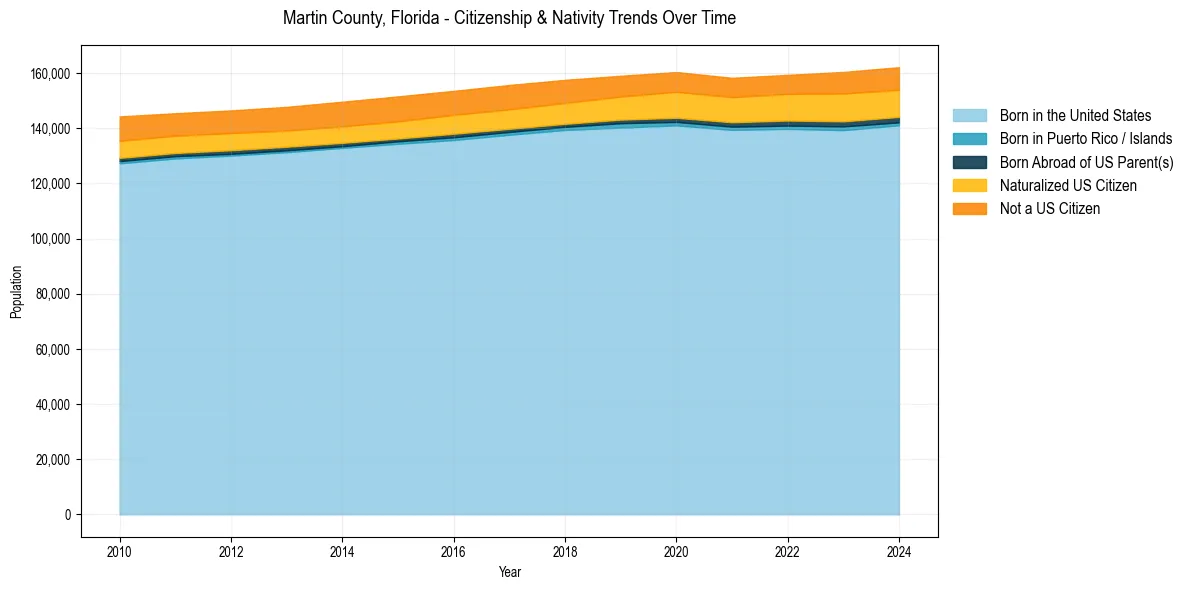
Martin County, Florida Population & Nativity History
| Year | Total Pop | Foreign Born | Native Born |
|---|---|---|---|
| 2024 | 162,176 | 11.1% | 88.9% |
| 2023 | 160,464 | 11.2% | 88.8% |
| 2022 | 159,399 | 10.4% | 89.6% |
| 2021 | 158,323 | 10.2% | 89.8% |
| 2020 | 160,420 | 10.3% | 89.7% |
| 2019 | 159,065 | 10.0% | 90.0% |
| 2018 | 157,581 | 10.1% | 89.9% |
| 2017 | 155,719 | 10.2% | 89.8% |
| 2016 | 153,592 | 10.1% | 89.9% |
| 2015 | 151,586 | 10.1% | 89.9% |
| 2014 | 149,658 | 10.0% | 90.0% |
| 2013 | 147,786 | 9.8% | 90.2% |
| 2012 | 146,497 | 9.8% | 90.2% |
| 2011 | 145,480 | 9.9% | 90.1% |
| 2010 | 144,322 | 10.4% | 89.6% |
Nativity & Citizenship FAQs for Martin County, Florida
Approximately 11.1% of residents in Martin County, Florida were born outside the United States.
The vast majority of residents, roughly 94.9%, are U.S. citizens (including both native-born and naturalized citizens).