Miami-Dade County, Florida Age & Gender Distribution (2024)
Population distribution by age and gender for Miami-Dade County, Florida
Miami-Dade County, Florida Age & Gender Statistics (2024)
Total Population
2,738,356
Median Age
40.7
Male Median
39.4
Female Median
42.1
Miami-Dade County, Florida Population Growth
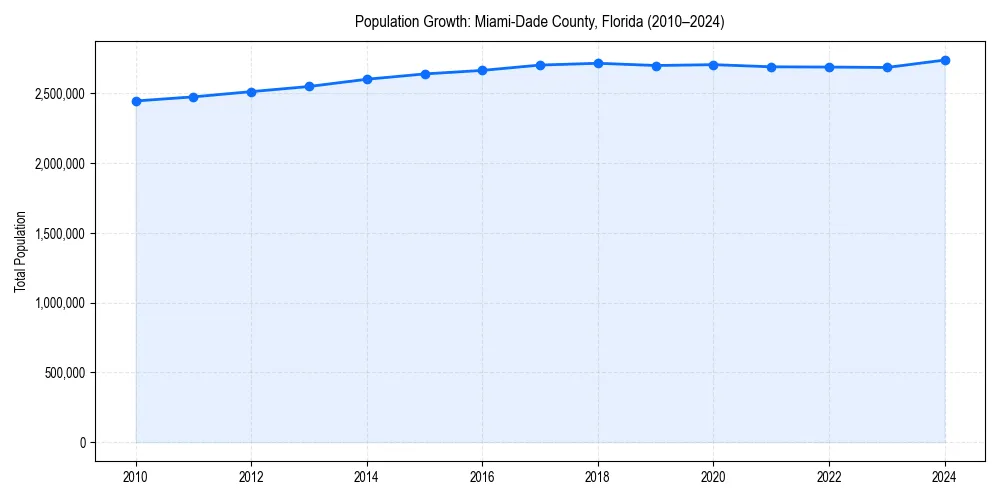
Miami-Dade County, Florida Demographic Trend
Since 2010, the population of has changed by +12.0%%.
+12.0%% Growth
Miami-Dade County, Florida Age & Gender Pyramid
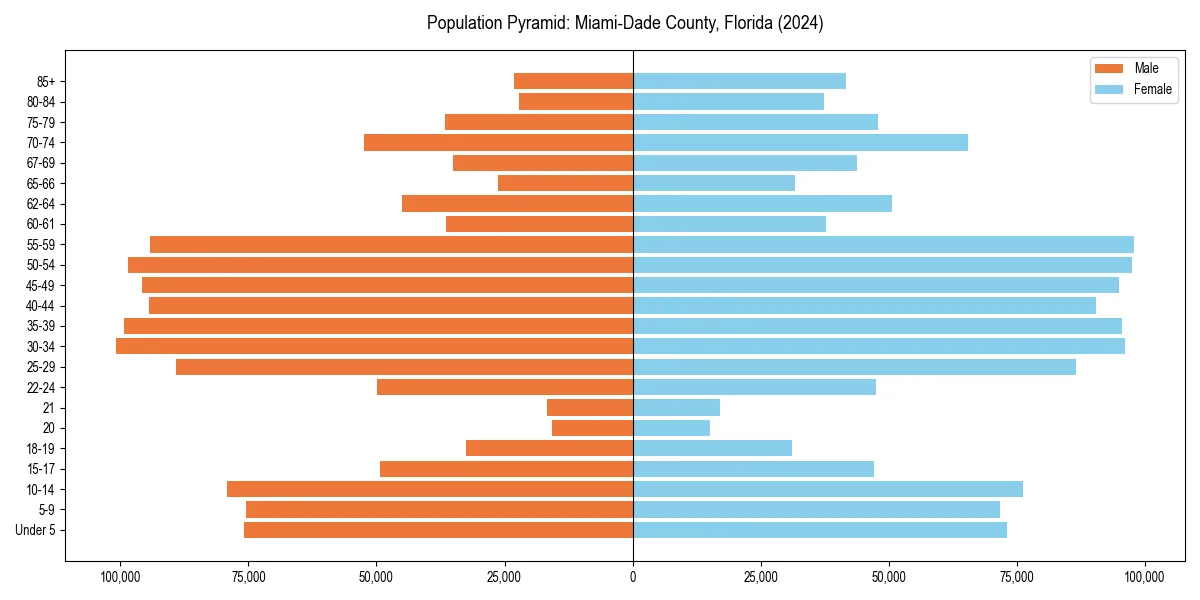
Figure 2: Population distribution by age and gender for 2024.
Miami-Dade County, Florida Historical Population Data
| Year | Median Age | Population |
|---|---|---|
| 2024 | 40.7 | 2,738,356 |
| 2023 | 40.8 | 2,685,296 |
| 2022 | 40.6 | 2,688,237 |
| 2021 | 40.4 | 2,690,113 |
| 2020 | 40.2 | 2,705,528 |
| 2019 | 39.9 | 2,699,428 |
| 2018 | 39.7 | 2,715,516 |
| 2017 | 39.5 | 2,702,602 |
| 2016 | 39.3 | 2,664,418 |
| 2015 | 39.0 | 2,639,042 |
| 2014 | 38.8 | 2,600,861 |
| 2013 | 38.5 | 2,549,075 |
| 2012 | 38.2 | 2,512,219 |
| 2011 | 38.0 | 2,474,676 |
| 2010 | 37.7 | 2,445,374 |
Miami-Dade County, Florida Age Group Breakdown (2024)
| Age Cohort | Percentage |
|---|---|
| Under 5 | 5.4% |
| 5–17 | 14.6% |
| 18–24 | 8.2% |
| 25–34 | 13.6% |
| 35–54 | 28.0% |
| 55–64 | 13.2% |
| 65+ | 16.9% |
Dependency Ratios for Miami-Dade County, Florida
- Total Dependency Ratio:
- 58.6
- Youth Dependency:
- 31.7
- Old-Age Dependency:
- 26.9
The dependency ratio measures dependents (ages 0-17 and 65+) per 100 working-age individuals (ages 18-64).
Age & Gender FAQs for Miami-Dade County, Florida
The median age in Miami-Dade County, Florida is 40.7 years.
According to latest Census data, the total population of Miami-Dade County, Florida is 2,738,356.
In Miami-Dade County, Florida, seniors (ages 65+) make up 16.9% of the population, while children under 18 represent 14.6%.
Based on historical data since 2010, the population in Miami-Dade County, Florida is aging.