Miami-Dade County, Florida Nativity & Citizenship Status (2024)
Place of birth and citizenship status analysis for Miami-Dade County, Florida
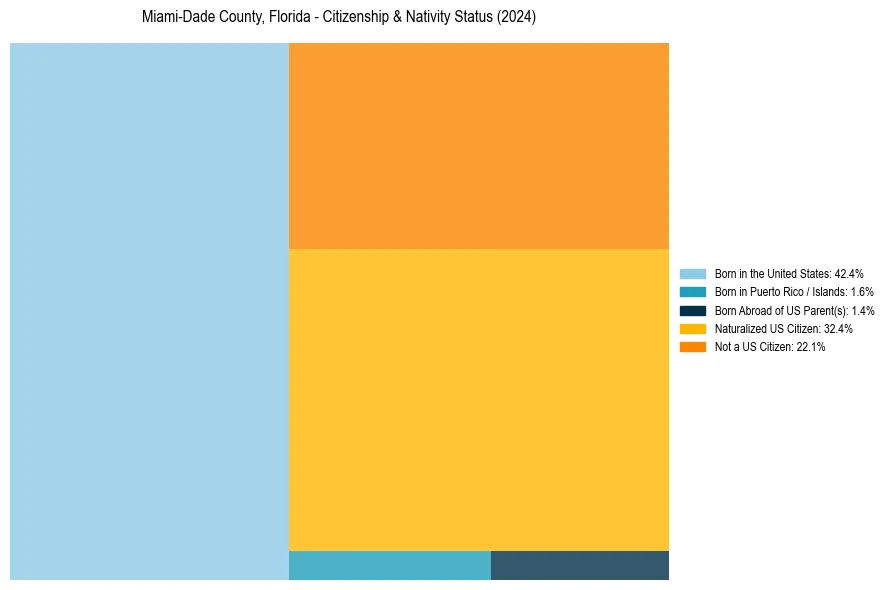
Miami-Dade County, Florida Nativity & Citizenship Indicators (2024)
Native Born
45.5%
Foreign Born
54.5%
Naturalized
32.4%
US Citizens
77.9%
Miami-Dade County, Florida Nativity & Citizenship Distribution
Miami-Dade County, Florida Historical Nativity Trends (2010–2024)
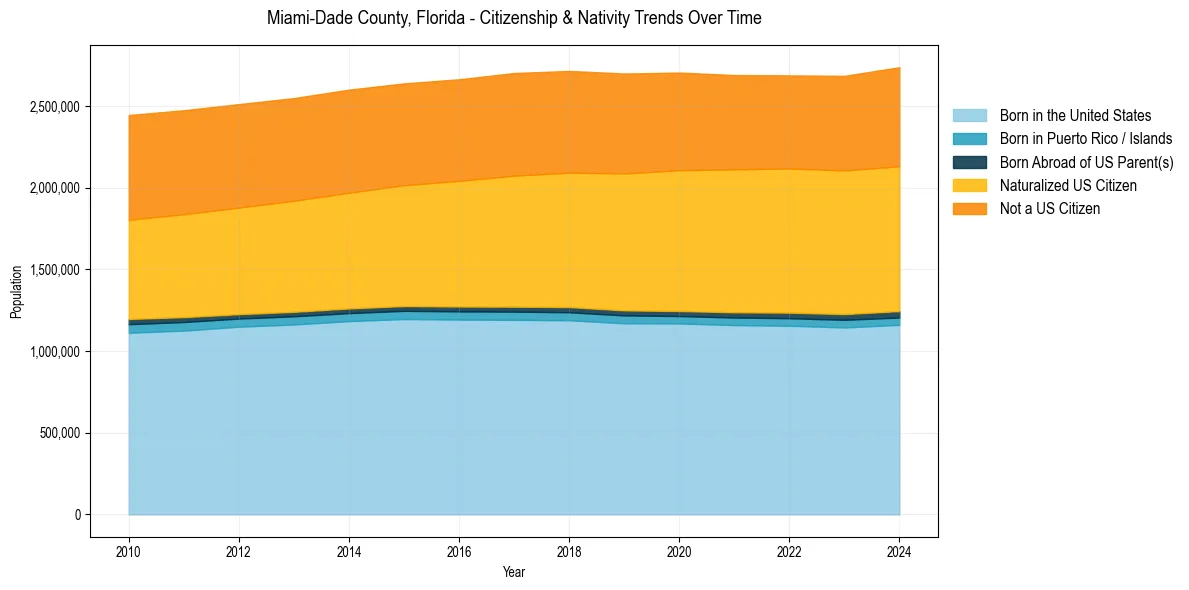
Miami-Dade County, Florida Population & Nativity History
| Year | Total Pop | Foreign Born | Native Born |
|---|---|---|---|
| 2024 | 2,738,356 | 54.5% | 45.5% |
| 2023 | 2,685,296 | 54.3% | 45.7% |
| 2022 | 2,688,237 | 54.0% | 46.0% |
| 2021 | 2,690,113 | 54.0% | 46.0% |
| 2020 | 2,705,528 | 54.0% | 46.0% |
| 2019 | 2,699,428 | 53.7% | 46.3% |
| 2018 | 2,715,516 | 53.3% | 46.7% |
| 2017 | 2,702,602 | 52.9% | 47.1% |
| 2016 | 2,664,418 | 52.2% | 47.8% |
| 2015 | 2,639,042 | 51.7% | 48.3% |
| 2014 | 2,600,861 | 51.5% | 48.5% |
| 2013 | 2,549,075 | 51.3% | 48.7% |
| 2012 | 2,512,219 | 51.2% | 48.8% |
| 2011 | 2,474,676 | 51.2% | 48.8% |
| 2010 | 2,445,374 | 51.1% | 48.9% |
Nativity & Citizenship FAQs for Miami-Dade County, Florida
Approximately 54.5% of residents in Miami-Dade County, Florida were born outside the United States.
The vast majority of residents, roughly 77.9%, are U.S. citizens (including both native-born and naturalized citizens).