Palm Beach County, Florida Health Insurance Coverage (2024)
Detailed analysis of uninsured rates and coverage trends for Palm Beach County, Florida
Universe
1,519,770
Total Uninsured
200,373
Uninsured Rate
13.2%
Coverage by Age and Gender
Distribution of insured vs. uninsured residents in Palm Beach County, Florida
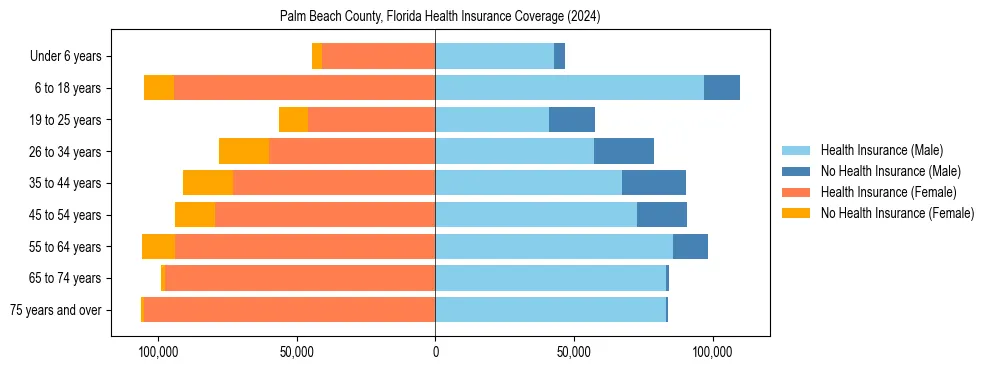
Uninsured Rates by Demographic Group
Under 18 Years
Male Uninsured10.9%
Female Uninsured9.5%
18 to 34 Years
Male Uninsured28.3%
Female Uninsured21.4%
35 to 64 Years
Male Uninsured19.3%
Female Uninsured15.2%
65 Years & Over
Male Uninsured0.9%
Female Uninsured1.1%
Uninsured Rate Trends
Historical coverage data from 2012 to 2024
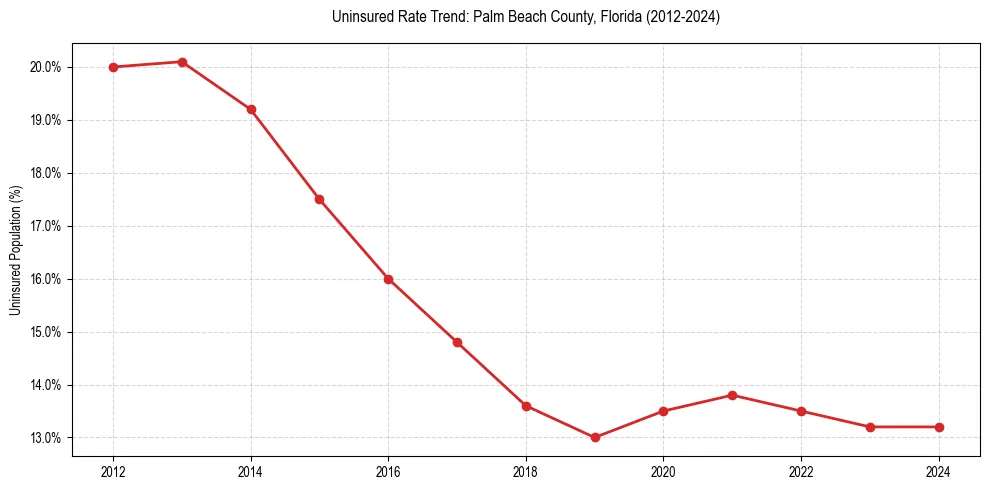
| Year | Total Uninsured | Uninsured Rate |
|---|---|---|
| 2024 | 200,373 | 13.2% |
| 2023 | 196,856 | 13.2% |
| 2022 | 200,159 | 13.5% |
| 2021 | 202,404 | 13.8% |
| 2020 | 197,976 | 13.5% |
| 2019 | 189,280 | 13.0% |
| 2018 | 195,310 | 13.6% |
| 2017 | 209,909 | 14.8% |
| 2016 | 221,310 | 16.0% |
| 2015 | 239,681 | 17.5% |
| 2014 | 259,169 | 19.2% |
| 2013 | 266,135 | 20.1% |
| 2012 | 262,347 | 20.0% |
Frequently Asked Questions
Approximately 13.2% of the population in Palm Beach County, Florida does not have health insurance coverage.
In Palm Beach County, Florida, young adult males (18-34) face the highest barrier to coverage, with an uninsured rate of 28.3%. This is notably higher than the overall local average of 13.2%.